2026 Global Desalination Market at a Glance
The global water desalination market is valued at USD 19.61 billion in 2026 and is forecast to reach USD 29.92 billion by 2031 at an 8.82% CAGR, with policy framing desalination as core national infrastructure rather than emergency capacity (Mordor Intelligence, 2026-04). The Middle East and Africa hold a 38.1% market share in 2026 and are simultaneously the largest and fastest-growing region, anchored by Saudi Arabia, the UAE and Qatar, where sovereign water-security funds underwrite multi-billion-dollar PPPs for both municipal supply and industrial offtake. Asia Pacific is the second growth engine on the back of China and India's industrial and municipal demand, while North America is scaling large SWRO projects such as the 100 MGD Harbor Island facility in South Texas, awarded to IDE Technologies in June 2026.
The 2026 reports segment the market along four axes: technology (RO, MSF, MED, others), source (sea, brackish, wastewater, others), application (municipal, industrial, others), and geography (NA, EU, APAC, MEA, LATAM). For an industrial buyer, the technology-source intersection matters more than the headline regional share, because the pretreatment and RO configuration that protects a membrane and survives a 20-year BOOT contract is decided at that level, not at the country level.
| Metric | 2026 Value | Source / Note |
|---|---|---|
| Global market size | USD 19.61 B | Mordor Intelligence, 2026-04 |
| 2031 forecast | USD 29.92 B | Mordor Intelligence, 2026-04 |
| CAGR 2026–2031 | 8.82% | Mordor Intelligence, 2026-04 |
| Largest region (2026) | MEA, 38.1% share | Mordor Intelligence, 2026-04 |
| Fastest-growing region | MEA | Mordor Intelligence, 2026-04 |
| Headline NA project | Harbor Island 100 MGD SWRO, South Texas | IDE Technologies award, 2026-06 |
Middle East & Africa: The 38% Anchor Market
MEA's 38.1% share in 2026 is structural, not cyclical: the region has negligible surface water, an arid climate that drives per-capita demand above 500 L/day in Gulf states, and sovereign balance sheets willing to fund 25-year water-security PP (per Mordor Intelligence 2026 commentary). Saudi Arabia's continued expansion under Vision 2030, the UAE's Hassyan and Taweelah expansions, and Qatar's Ras Abu Fontas retrofits keep MEA capacity additions ahead of every other region in 2026.
The 2026 MENA technology mix is a hybrid: legacy MSF and MED plants remain in operation because they are tied to captive power and co-generation steam, but new build and major retrofits are dominated by RO. Hybrid MED-RO trains are common in retrofits where thermal capacity is preserved for peak-load shaving and RO handles the baseload at 3–5 kWh/m³ versus 12–18 kWh/m³ for MSF (typical engineering range, IEA-Warmem 2025). Source water is overwhelmingly seawater on the coast; brackish water serves inland industrial sites in the Eastern Province of Saudi Arabia and selected agricultural schemes in Egypt and Morocco.
Industrial demand is the swing variable: refineries, petrochemicals (Sadara, Yanbu, Borouge), gas processing, and combined-cycle power all draw high-purity demin water, and 2026 has added a new layer — green-hydrogen projects in NEOM, Saudi Arabia and the UAE, where electrolyzers require <1 µS/cm feed and 99.9% availability. The implication for pretreatment is direct: high-TSS, high-fouling Gulf seawater (typically 35,000–45,000 mg/L TDS, 5–50 NTU turbidity at intake) drives the use of DAF and multi-media filtration upstream of SWRO. A DAF system for SWRO pretreatment handles the algal and oil-bearing load common in Gulf intakes, while a multi-media filter for RO membrane protection brings SDI below 3 before the high-pressure pumps.
| MEA 2026 Driver | Engineering Consequence |
|---|---|
| 35,000–45,000 mg/L TDS seawater | Two-pass RO or 85–90% single-pass recovery |
| SDI 5–15 at open intake | DAF + MMF + cartridge, target SDI < 3 |
| Green-hydrogen offtake | Electrolyzer-grade polishing, < 1 µS/cm |
| Thermal asset retention | Hybrid MED-RO retrofits, 3–5 kWh/m³ |
Asia Pacific: The Silent Second Growth Engine
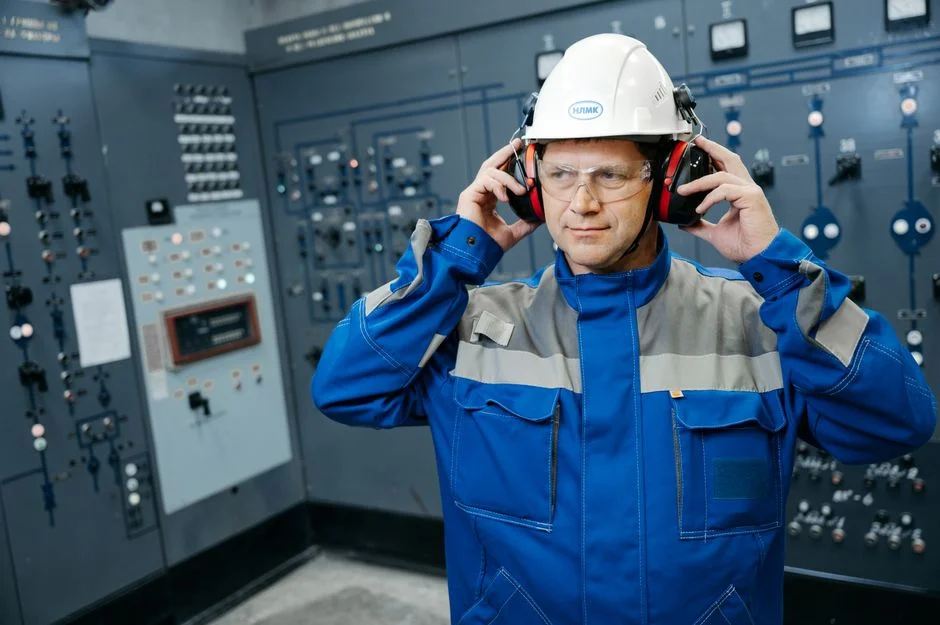
APAC is the second-largest growth contributor in 2026 but receives less press than MENA because growth is distributed across hundreds of municipal and industrial sites rather than concentrated in megaprojects. Coastal Chinese cities (Tianjin, Qingdao, Beijiang) and Indian metros (Chennai, Mumbai, Surat) drive municipal demand, while electronics fabs in Taiwan and Korea, pharma in India, and steel in coastal China and Southeast Asia drive industrial demand (per Mordor Intelligence 2026 commentary).
Source mix is the differentiator: brackish water plays a far larger role in APAC than in MENA because inland industrial corridors in northern China, Rajasthan, and central India have limited access to seawater. Brackish feed at 1,000–5,000 mg/L TDS cuts specific energy to 0.5–1.5 kWh/m³ but raises scaling risk (CaCO₃, BaSO₄, SrSO₄) and forces tighter antiscalant dosing. RO dominates new builds, with brine management becoming a procurement decision driver in 2026 under tightening Chinese and Indian discharge rules — China's GB/T 18921 reuse standard and India's CPCB effluent norms now push zero-liquid-discharge discussions from optional to expected in coastal industrial zones.
Industrial process-water reuse is overlapping with desalination in APAC, because the same RO train can serve both duties. An industrial RO system with up to 95% recovery configured for brackish feed will deliver reuse-grade permeate for a textile dye house or a steel cooling loop, and the concentrate can be further processed in a crystallizer or a membrane brine concentrator. For smaller industrial sites that need a packaged solution, an integrated water purification skid combines media filtration, antiscalant dosing and RO in a single footprint.
| APAC 2026 Driver | Engineering Consequence |
|---|---|
| Brackish feed 1,000–5,000 mg/L TDS | Single-pass RO at 75–80% recovery, low SEC |
| High scaling index (CaSO₄, BaSO₄) | PLC-controlled antiscalant dosing, CIP every 30–60 days |
| Tightening GB/T 18921 / CPCB discharge | High-recovery RO + brine concentration, ZLD optional |
| Electronics / pharma demand | Two-pass RO + EDI, < 0.1 µS/cm polish |
North America: Large-Scale SWRO Returns
North America is no longer a niche 2026 market. The IDE Technologies selection by the Nueces River Authority to develop the 100 MGD Harbor Island seawater desalination facility in South Texas, announced June 2026, signals that US Gulf coast utilities are now willing to sign long-term offtake PP for SWRO at a scale previously reserved for MENA (Mordor Intelligence, 2026-06). California's Carlsbad continues to anchor Pacific coast capacity, and new brackish projects in the Permian Basin and the Southwest are tied to oil & gas produced-water reuse and combined-cycle power.
The procurement signal is more important than the project itself. Once a 100 MGD SWRO plant is under a 30-year O&M contract with membrane and energy-recovery performance guarantees, the addressable market for retrofit membranes, energy-recovery device service, and online CIP expands for the life of the asset. North American buyers are standardizing on modular RO skids with high recovery (85–90% on seawater), paired with online CIP and PLC-controlled chemical dosing for antiscalant and CIP to keep membrane life above the 7-year warranty threshold. An industrial RO system with up to 95% recovery in a modular frame fits this duty when paired with energy-recovery turbines on the concentrate stream.
| North America 2026 Driver | Engineering Consequence |
|---|---|
| Harbor Island 100 MGD SWRO, 2026-06 | Standardized modular skids, 85–90% recovery |
| Permian / SW brackish for O&G | 75–80% recovery, 0.5–1.0 kWh/m³ |
| 30-year O&M guarantees | Online CIP, membrane life > 7 years |
| US EPA brine discharge variance | Higher-recovery RO + diffuser studies |
Europe & Latin America: Smaller Share, Stricter Rules
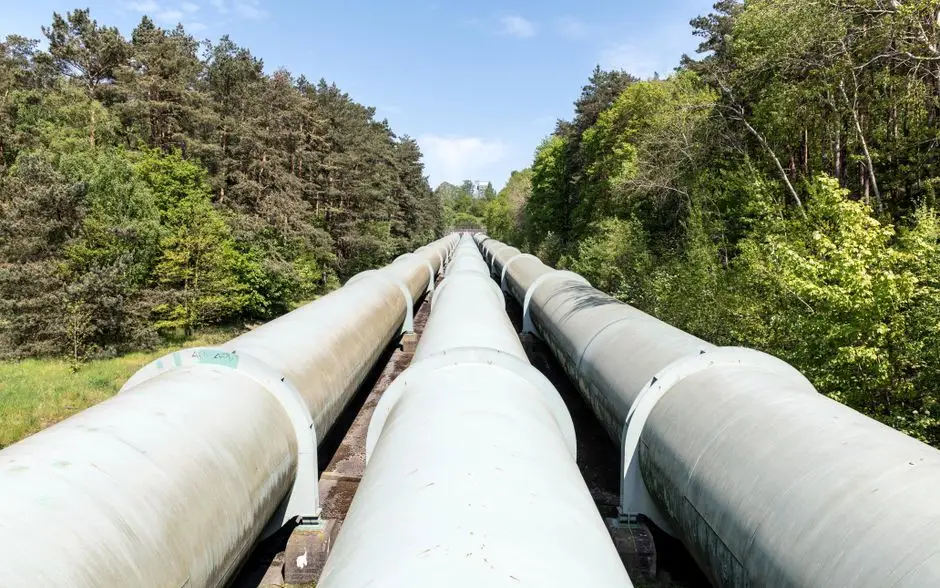
Europe holds a single-digit share of the 2026 global market but growth is real and concentrated: Mediterranean islands (Cyprus, Malta, the Canaries), coastal Spain, and Greece where municipal demand overlaps with tourism-driven seasonal peaks. Latin America is led by Chile (mining), Peru (copper and municipal), and Brazil (oil & gas and municipal); the Bogotá and Rio de Janeiro reuse projects have become reference installations for industrial reuse in 2026.
Volume is lower but the compliance burden is higher, so equipment choice shifts toward monitoring, reuse, and closed-loop configurations. The EU Industrial Emissions Directive 2010/75/EU, updated BREF for Common Waste Water and Waste Gas Treatment (2025 reference), and equivalent LATAM frameworks are pushing buyers toward higher-recovery RO and MBR-based reuse trains, where the MBR upstream of RO keeps the RO clean and the higher-recovery RO keeps the brine volume manageable for evaporation ponds or crystallizers. An MBR integrated wastewater treatment train upstream of a high-recovery RO is the configuration most EU and Chilean engineering firms are specifying in 2026 bids.
| Europe / LATAM 2026 Driver | Engineering Consequence |
|---|---|
| Mediterranean island municipal + tourism | Modular SWRO, seasonal turndown |
| IED 2010/75/EU and BREF updates | Higher-recovery RO + brine minimization |
| Chile / Peru mining demand | Brackish RO 80–85% recovery, 0.8–1.2 kWh/m³ |
| Bogotá / Rio reuse projects | MBR + RO reuse trains, > 90% water recovery |
Translating 2026 Regional Signals into Equipment Choices
The macro data above is only useful if it changes a specification. The decision framework for an industrial buyer in 2026 follows four steps: feed-water quality → pretreatment intensity → RO configuration → post-treatment and brine handling. The table below maps each regional scenario to a concrete equipment stack, with the inline anchor pulled from earlier in the article.
| Region / Feed | Pretreatment | RO Configuration | Post-treatment / Brine |
|---|---|---|---|
| MENA: 38–45 g/L seawater, high TSS | DAF system for SWRO pretreatment + multi-media filter for RO membrane protection + PLC-controlled chemical dosing for antiscalant and CIP | Industrial RO system with up to 95% recovery, two-pass for green-hydrogen polish | Brine to solar evaporation or hybrid MED-RO reuse |
| APAC: 1–5 g/L brackish or coastal seawater | Multi-media filter + PLC-controlled chemical dosing for antiscalant and CIP | Industrial RO system with up to 95% recovery, single-pass on brackish; ZLD crystallizer for coastal | Reuse permeate to process, brine to crystallizer or outfall under GB/T 18921 |
| Americas: 35 g/L Gulf seawater or 1–8 g/L brackish | DAF + multi-media filter for RO membrane protection + PLC-controlled chemical dosing for antiscalant and CIP | Industrial RO system with up to 95% recovery, energy-recovery turbine on concentrate | Brine diffuser or crystallizer, online monitoring for permeate quality |
| Europe / LATAM: municipal + industrial reuse | MBR integrated wastewater treatment train + multi-media filter for RO membrane protection | Industrial RO system with up to 95% recovery, closed-loop on permeate | Brine minimization for IED compliance, evaporator optional |
If you are in MENA, your stack is DAF + multi-media filter + chemical dosing + two-pass RO. If you are in APAC, your stack is multi-media filter + chemical dosing + single-pass RO with brine concentration. If you are in the Americas, your stack is DAF + multi-media filter + chemical dosing + modular RO with energy recovery. Europe and LATAM buyers should start with MBR + RO reuse, sized against the 2010/75/EU BREF update. For a deeper read on RO recovery rates and reuse economics in 2026 and on industrial water reuse trends for 2026, the engineering specs and ROI math are laid out in the linked buyer guides.
Frequently Asked Questions
What is the 2026 size of the global water desalination market? USD 19.61 billion in 2026, forecast to reach USD 29.92 billion by 2031 at an 8.82% CAGR (Mordor Intelligence, 2026-04).
Which region leads the desalination market in 2026? The Middle East and Africa, with 38.1% market share and the highest regional growth rate (Mordor Intelligence, 2026-04).
What is the largest 2026 North American SWRO project? The 100 MGD Harbor Island facility in South Texas, awarded to IDE Technologies in June 2026 (Mordor Intelligence, 2026-06).
Which technology dominates new desalination build in 2026? Reverse osmosis, with hybrid MED-RO retained in MENA retrofits where thermal assets are still in service.
Why is Asia Pacific the second growth engine in 2026? Coastal Chinese and Indian municipal demand plus industrial demand from electronics, pharma and steel, with brackish water RO dominating inland sites (per Mordor Intelligence 2026 commentary).