Smart Water Monitoring Growth Rate in 2026: Reconciling the Numbers
Three analyst houses released 2026 baselines for the global smart water management market within eight months of each other, and they don't agree on a single number. The reconciliation matters more than any one figure: a procurement manager who cites the wrong CAGR to a board will either under-budget 2026 capex or over-spec it against a baseline that doesn't exist.
| Source | 2026 Market Value | Forecast Horizon | 2033 Value | CAGR (2026–2033) | Scope Bias |
|---|---|---|---|---|---|
| Coherent Market Insights (2026-04) | USD 19.75B | 2033 | USD 50.34B | 14.3% | Excludes some consumer hardware; solutions segment 58.7% |
| Future Market Insights (2026-01) | USD 22.6B | 2033 | USD 50.9B | 12.3% | Sits in the middle; historical 2020–2025 CAGR 11.7% |
| MarketsandMarkets (2026-07) | USD 28.84B | 2032 | USD 52.15B | 10.4% | Includes smart meters, valves, and controllers; largest scope |
The USD 9.09 billion spread between Coherent and MarketsandMarkets is almost entirely a scope difference. Coherent's 14.3% CAGR is the steepest because its 2026 base excludes some hardware categories; MarketsandMarkets' 10.4% is the most conservative because it bundles smart meters, smart valves, and controllers into the base year. Future Market Insights' 12.3% sits in the middle with a 2020–2025 historical CAGR of 11.7% — the only source that actually published a backward-looking base rate, which makes its forward projection easier to defend in a board memo.
What the three sources do agree on is direction: water scarcity, non-revenue water losses above 30% in many distribution networks, aging infrastructure (the U.S. EPA's 7th Drinking Water Infrastructure Needs Survey, published 2024, still cites a USD 625 billion 20-year gap), and stricter discharge permits are pushing double-digit growth into the back half of the decade. For an industrial buyer, the takeaway is that the 10.4–14.3% band is a procurement signal, not a market statistic — 2026 capex is being deployed against a rising technology baseline, and a device spec'd today must still be defensible in 2030.
What the 41% IoT Share and 28% Asia Pacific Number Mean for Industrial Plants
Two segment numbers from Coherent's April 2026 release drive the architecture and geography decisions a 2026 plant engineer has to make: the IoT architecture class holds 41% of global share — the largest single architecture — and Asia Pacific holds 28% of regional share with the fastest forecast growth. China, India, and Singapore are the named deployment leaders.
The 41% IoT share is the most actionable figure for an industrial buyer. It means the dominant 2026 architecture is no longer "smart meter + SCADA" but a layered system: edge sensors publishing to a gateway, gateway publishing to a cloud historian, and the historian feeding both OT dashboards and IT analytics. Veolia's February 2026 announcement — two 15-year contracts covering Mumbai's largest water treatment plants, deploying advanced digital water technologies — is the reference benchmark for what an IoT-native 2026 contract looks like at municipal scale (per MarketsandMarkets, 2026-07). For industrial procurement, the same architecture translates into a plant-wide sensor mesh plus AMI metering, with the option to feed corporate ESG reporting systems directly from the cloud layer.
The 28% Asia Pacific share is a different signal. Future Market Insights' January 2026 report shows North America still leading the 2025 installed base — retrofit-heavy, SCADA-dominant, AMR upgrades common. Asia Pacific's 28% share is forward-looking: greenfield plants, IoT-native from day one, with the regulatory push coming from tightening Chinese discharge standards (GB 18918-2002 amendments in force), India's Central Pollution Control Board consents, and Singapore's PUB specifications. The practical division is this — greenfield plants in Asia and Africa go IoT-native; North American and European plants retrofit legacy SCADA with IoT overlays. Both paths converge on the same 2026 device spec: open protocols, edge buffer, and cloud export.
Smart Water Monitoring Devices: AMI, AMR, and IoT Sensor Mesh Compared
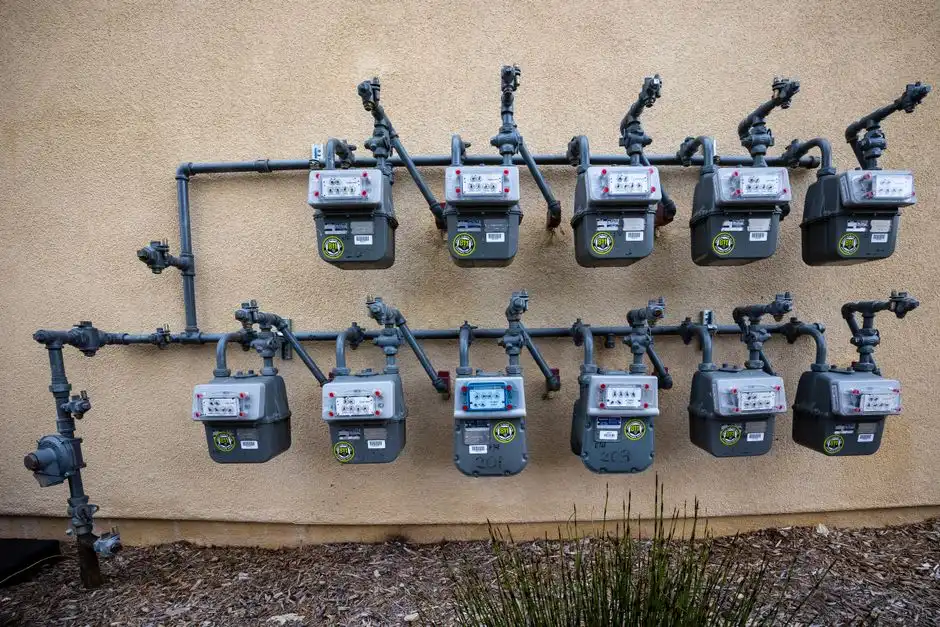
Top-ranking market pages stop at the 41% IoT figure and never tell a buyer what an IoT device class actually does. The 2026 device market splits into three functional classes, and a plant engineer needs all three for a complete wastewater monitoring scope — not a choice among them.
| Class | Communication | Primary Measurement | Typical Use Case (2026) | Capex Profile |
|---|---|---|---|---|
| AMI water meter | Two-way, always-on (cellular, LoRaWAN, NB-IoT) | Flow, consumption, reverse-flow detection, tamper | Default for new industrial installations; remote shutoff and demand response | Higher unit cost, lower lifecycle opex |
| AMR water meter | One-way, walk-by or drive-by radio read | Flow, consumption (no reverse-flow analytics) | Existing residential or utility networks; faster billing, no real-time data | Lowest capex, highest manual labor |
| Communication network meter / IoT sensor mesh | Two-way mesh (Wireless M-Bus, LoRaWAN, MQTT-over-cell) | Water quality: pH, turbidity, ORP, DO, conductivity, residual chlorine, UV-Vis COD proxy | Industrial wastewater inlets/outlets, compliance sampling, leak precursor detection | Per-parameter; scales with sensor count |
AMI meters answer "how much water moved and when." IoT sensor meshes answer "what was in the water when it moved." AMR is a 2026 fit only where the buyer is upgrading an existing one-way network to automated reads — typically residential or light-commercial. A 2026 industrial wastewater plant running a discharge permit needs AMI for process-water accountability and an IoT sensor mesh for compliance parameters. An integrated MBR wastewater treatment system with online monitoring-ready PLC is the typical 2026 greenfield configuration — the membrane skids are delivered with a PLC that already publishes turbidity, TSS, and transmembrane pressure to the plant historian. For chemical-stage control, a PLC-controlled automatic chemical dosing system closes the loop between online residual-chlorine measurement and dosing pump speed. Pretreatment polishing upstream of the MBR is typically a multi-media filter with turbidity/TSS monitoring-ready outlets, which gives the sensor mesh a stable sample point between backwash cycles.
Industrial Parameters a 2026 Smart Monitoring System Should Cover
Stricter 2026 discharge rules in the EU Industrial Emissions Directive, China's GB 18918-2002, and ASEAN effluent guidelines are the regulatory engine behind the 10.4–14.3% market growth. The parameter list a buyer writes into an RFQ has to map back to those rules, or the monitoring spend is decorative.
| Category | Parameter | Typical 2026 Sensor Range / Accuracy | Regulatory Anchor |
|---|---|---|---|
| Physical / chemical | pH | 0–14, ±0.02 | EU IED, GB 18918-2002 |
| Physical / chemical | Temperature | 0–100 °C, ±0.1 °C | All jurisdictions |
| Physical / chemical | Conductivity | 0–20,000 µS/cm, ±2% | EU IED, US NPDES |
| Physical / chemical | Turbidity (NTU) | 0–1000 NTU, ±2% | All jurisdictions |
| Physical / chemical | Total suspended solids (TSS) | 0–5000 mg/L, ±5% (optical proxy) | EU IED, GB 18918-2002 |
| Physical / chemical | Dissolved oxygen (DO) | 0–20 mg/L, ±0.1 mg/L | EU IED biological treatment |
| Physical / chemical | ORP | -1500 to +1500 mV, ±2 mV | Disinfection control |
| Organic load | BOD / COD / TOC | COD via UV-Vis proxy 0–10,000 mg/L, ±5%; TOC direct 0–2000 mg/L | EU IED, GB 18918-2002 |
| Nutrients | NH₃-N, TN, TP | NH₃-N 0–1000 mg/L ion-selective, ±5%; TN/TP via online digestion | EU IED, China DB44, ASEAN |
| Disinfection residuals | Free Cl₂, total Cl₂, ClO₂ | 0–20 mg/L amperometric, ±0.05 mg/L | WHO, US EPA, EU bathing water |
| Heavy metals | Cr, Cu, Ni, Zn, Pb | ppb-range online voltammetry; or lab ICP-MS confirmation | EU IED, China GB 18918-2002 Table 1 |
The heavy-metals row is where most 2026 RFQs fall down — online voltammetric analyzers are now commercially mature for the six metals listed above, and the heavy metals online monitoring system 2026 guide covers the engineering trade-offs (capex vs. detection limit, online vs. at-line confirmation cadence). For broader context on how the 2026 monitoring spend interacts with process control and AI optimization, the AI in wastewater treatment 2026 trends piece is the right cross-reference.
Why the April 2026 Potomac Incident Matters for Plant Operators

On April 21 2026, the U.S. Justice Department initiated legal action against Washington, D.C., and its water and sewer authority over a 72-inch pipeline — the Potomac Interceptor — that collapsed on January 19 2026 and released untreated sewage into the Potomac River in Montgomery County, Maryland (per Associated Press, cited in Coherent Market Insights 2026-04). The legal exposure is the part an industrial buyer should read twice.
The direct industrial translation is risk: a single undetected pipe or tank failure on an industrial site can trigger EPA Clean Water Act liability — civil penalties currently up to USD 64,000 per day per violation under the 2024 inflation-adjusted table — plus downtime and brand damage that no insurance carrier fully covers. Continuous smart monitoring (pressure + flow + level sensors) detects the precursor signature of such failures — falling pressure, anomalous flow decay, rising wet-well level — 24 to 72 hours earlier than periodic grab sampling. On a 2026 capex project, the marginal cost of adding continuous pressure and flow monitoring on the discharge line is typically 1–3% of total instrumentation cost. The Potomac penalty exposure makes that line item non-negotiable on any U.S.-based plant; the same logic applies under EU Directive 2008/99 for European sites.
2026 Procurement Checklist: What Industrial Buyers Should Spec
The market-research-firm press releases that rank for "smart water monitoring growth rate 2026" give buyers a CAGR and nothing to act on. The following checklist converts the analysis above into a spec line items can be written against today.
- Architecture: IoT sensor mesh + AMI metering as the 2026 default. Specify AMR only where an existing one-way network is being upgraded to automated reads. Greenfield plants in Asia and Africa should spec IoT-native; North American and European retrofits should overlay IoT onto existing SCADA.
- Communications: Open protocols only — MQTT, Modbus TCP, OPC UA, or Wireless M-Bus. Reject proprietary vendor lock-in; require gateway-to-cloud export in a documented schema.
- Edge capability: On-device buffer (minimum 72 hours of 1-minute data) and edge-resident logic so monitoring survives WAN outages. This is non-negotiable for remote plant sites and for any post-Potomac compliance posture.
- Data integration: SCADA or DCS-ready, with cloud historian export for trend analysis. The SCADA vs PLC for water treatment 2026 comparison covers when each is the right fit; the DCS system for sewage treatment 2026 engineering buyer's guide covers distributed architectures for multi-skid plants; the PLC control for food processing wastewater plant 2026 engineering guide covers skid-level integration.
- Service: Lifecycle calibration interval, sensor replacement cost (per-parameter, per-year), and warranty terms specified up front in the RFQ. The 10.4–14.3% market growth is meaningless if sensor drift is unmanaged — a turbidity probe that drifts 15% in six months produces worse compliance data than a weekly grab sample.
Frequently Asked Questions
Q1: What is the 2026 CAGR of the smart water monitoring market?
10.4% to 14.3%, depending on the analyst. MarketsandMarkets (2026-07) reports 10.4% to 2032, Future Market Insights (2026-01) reports 12.3% to 2033, and Coherent Market Insights (2026-04) reports 14.3% to 2033. The spread is scope-driven, not methodology-driven; the directional agreement is the procurement-relevant signal.
Q2: Which region is growing fastest in smart water management?
Asia Pacific, with 28% of 2026 global share per Coherent Market Insights. China, India, and Singapore are the named deployment leaders, with Veolia's February 2026 Mumbai 15-year contracts as a reference benchmark.
Q3: What is the difference between AMI and AMR smart water meters?
AMI is two-way, always-on communication supporting real-time data, remote shutoff, and demand response — the 2026 default for new industrial installations. AMR is one-way automated reads (walk-by or drive-by radio), faster billing, lower capex, and no real-time data — suited to existing residential or utility-grade networks being upgraded.
Q4: What 2026 events are accelerating smart water monitoring adoption?
Veolia's February 2026 Mumbai contract awards, the January 19 2026 Potomac Interceptor collapse, and the April 21 2026 U.S. Justice Department action against the D.C. water authority. The Hyderabad water authority's May 2025 intelligent-audit deployment is the earliest cited municipal reference for sensor + valve + audit integration.
Q5: How big is the IoT segment of smart water management in 2026?
41% of global share per Coherent Market Insights (2026-04) — the largest single architecture class, exceeding both AMI-only metering deployments and SCADA-retrofit projects.