How Fast Is the Biogas-from-Wastewater Market Actually Growing in 2026?
The waste-derived biogas market is on a 5.77% CAGR for 2026–2034, growing from US$1.92 billion in 2025 to US$3.19 billion by 2034, with a cumulative addressable market of about US$23.12 billion across the forecast window (Verified Market Reports, 2026). Industrial wastewater is the fastest-rising feedstock segment because high-strength COD streams from food, beverage, and pulp & paper plants convert to methane at 0.20–0.50 m³ CH₄ per kg of volatile solids, turning a treatment cost into a revenue line under net-zero mandates.
That 5.77% headline is a blended average across four feedstock categories, and the dispersion matters for anyone sizing a project. Industrial wastewater AD is running well above the average as breweries, dairies, distilleries, and pulp mills face rising grid tariffs, landfill-diversion rules, and corporate Scope 1 reduction targets. Meanwhile landfill gas — the legacy segment — is decelerating because new diversion rules shrink the addressable waste stream and capped sites are finite. The 2026 base year is the practical entry point: equipment lead times for digesters, CHP units, and downstream polishing skids have stretched 6–10 months since 2024, and biomethane offtake tariffs in Europe (RED III) and parts of North America are increasingly indexed to earlier commissioning dates.
| Metric | Value | Source / Period |
|---|---|---|
| 2025 market size | US$1.92 billion | Verified Market Reports, 2026 baseline |
| 2034 market size (forecast) | US$3.19 billion | Verified Market Reports, 2026–2034 |
| CAGR 2026–2034 | 5.77% | Verified Market Reports, 2026 |
| Cumulative addressable market (TAM) | ~US$23.12 billion | Verified Market Reports, 2026–2034 |
| Historical baseline | 2021–2024 data | Verified Market Reports, 2026 |
| Fastest-growing segment | Industrial wastewater | Qualitative ranking from segment splits |
Which Wastewater Segments Are Pulling the Curve?
The Verified Market Reports segmentation splits the waste-derived biogas market into four feedstock types — Sewage, Industrial Wastewater, Agricultural Waste, and Landfill Gas — and industrial wastewater is outpacing the others for a structural reason: its COD profile (typically 5,000–50,000 mg/L) sits in the sweet spot for high-rate anaerobic digestion, where methane yield per cubic metre of reactor is 5–10× higher than municipal sewage. Food and beverage, brewery and dairy, pulp and paper, distillery, and pharmaceutical effluents all qualify, and they share a common economic logic — a treatment burden becomes a fuel stream once the digester is sized correctly.
Sewage sludge is the mature segment: growth tracks municipal WRRF upgrades and tightening sludge disposal rules such as the EU Urban Wastewater Treatment Directive (91/271/EEC) and its 2024 revision pushing phosphorus recovery and stricter sludge reuse limits. Agricultural waste has a large theoretical TAM but volatile economics tied to livestock cycles, manure handling logistics, and farm-scale payback periods. Landfill gas is the slowest-growing segment because new landfill capacity is being diverted, capped sites are finite, and methane capture regulations have largely been built out in OECD markets. For an industrial buyer reading these splits, the practical takeaway is that the industrial wastewater bucket is where the engineering detail, vendor ecosystem, and ROI timelines line up for an in-plant capex decision.
| Segment | Typical influent strength | Growth posture (2026) | Why |
|---|---|---|---|
| Industrial wastewater (food, beverage, pulp & paper, distillery, pharma) | 5,000–50,000 mg/L COD | Fastest growing | High methane yield per m³ reactor; net-zero mandate alignment; rising grid tariffs |
| Sewage sludge (municipal WRRF) | 300–800 mg/L COD (after primary) | Steady, tied to population and sludge disposal rules | EU 91/271/EEC and 2024 revision; mature vendor base |
| Agricultural waste (manure, crop residues) | Variable, 20,000–80,000 mg/L for raw manure | Large TAM, volatile economics | Logistics-bound, farm-scale payback long |
| Landfill gas | N/A (captured methane) | Slowest growing, legacy | New diversion rules, finite capped sites |
Plants in the industrial wastewater band typically pair AD with a MBR membrane bioreactor system for post-AD polishing where the digester effluent does not meet direct discharge or reuse limits on its own — a configuration that closes the loop between energy recovery and water reuse.
From Market CAGR to Plant Reality: What Does the Growth Mean for an Industrial Site?
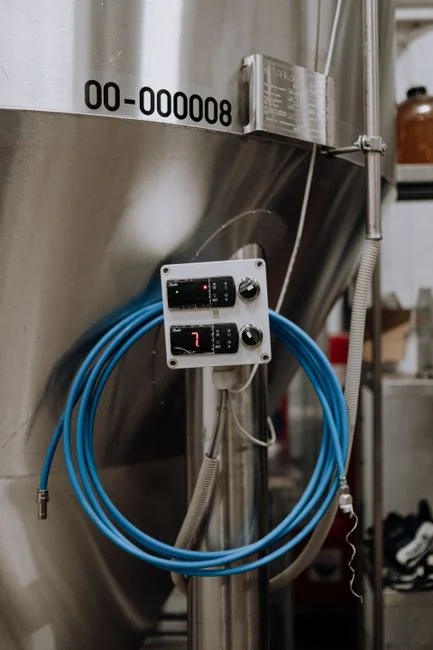
Translating 5.77% CAGR into a plant-level business case means converting market dollars into cubic metres of methane, reactor volume, and kilowatt-hours. For high-strength industrial wastewater, the methane-yield benchmark sits at 0.20–0.50 m³ CH₄ per kg of volatile solids (VS) added — a range that reflects feedstock biodegradability. A brewery or distillery stream will trend toward the upper bound; a pulp mill condensate toward the lower. At a typical organic loading rate (OLR) of 1–5 kg VS/m³·d and a hydraulic retention time (HRT) of 15–40 days, a 1,000 m³ CSTR can process 15–40 tonnes VS/d, yielding roughly 3,000–20,000 m³ CH₄/d depending on substrate and temperature (mesophilic 35–37°C versus thermophilic 50–55°C).
Capex for industrial-scale CSTR systems typically falls in the US$2,000–6,000 per m³ of reactor band, with the spread driven by mixing complexity, gas-holder sizing, and whether the project bundles a CHP unit. At industrial electricity tariffs of US$0.08–0.14/kWh, on-site CHP from digester gas delivers payback in roughly 4–8 years for high-COD food and beverage plants — a useful illustration band, not a guaranteed number, since feedstock variability, grid export rules, and digestate handling cost shift the answer for each site. Digestate dewatering is the line item that often gets under-scoped: a plate and frame filter press for digestate dewatering is the standard choice for plants pushing cake dryness above 22–25% DS, and pre-AD FOG and suspended solids are best handled upstream with a dissolved air flotation system for pre-AD FOG and solids removal to protect the digester from hydraulic shock and scum accumulation.
| Parameter | Typical range / value | Notes |
|---|---|---|
| CH₄ yield (industrial wastewater) | 0.20–0.50 m³ CH₄/kg VS added | Brewery/distillery upper bound; pulp condensate lower |
| HRT (mesophilic CSTR) | 15–40 days | Thermophilic shortens to ~10–20 days |
| OLR | 1–5 kg VS/m³·d | High-rate UASB/EGSB run higher, 10–30 kg COD/m³·d |
| Operating temperature | Mesophilic 35–37°C / Thermophilic 50–55°C | Thermophilic gives faster kinetics, higher heat demand |
| Capex band (CSTR, industrial scale) | US$2,000–6,000 per m³ reactor | Excludes land, grid interconnect, CHP |
| Payback (food & beverage, on-site CHP) | 4–8 years | At US$0.08–0.14/kWh industrial tariffs |
Digester Technologies Behind the 5.77% CAGR
The market growth is grounded in five digester configurations, each matched to a feedstock profile. CSTR (Continuously Stirred Tank Reactor) is the default for food and beverage, dairy, and municipal sludge — robust, well-understood, but mixing energy is significant at scale. UASB (Upflow Anaerobic Sludge Blanket) is the workhorse for soluble high-COD industrial streams like distillery and beet-sugar effluent, running at short HRT of 6–24 hours and high OLR of 10–30 kg COD/m³·d. EGSB (Expanded Granular Sludge Bed) is the higher-velocity UASB variant, useful for lower-strength soluble wastewater and growing in pharma and chemical sectors where footprint matters.
Plug-flow and covered lagoon digesters are the low-capex agricultural options, included here only to set the industrial-side contrast — they are rarely the right answer for a food or pulp plant discharging 24/7. AnMBR (anaerobic MBR) is the emerging hybrid at the high-COD / strict-effluent end, where the digester couples directly to membrane separation to deliver reusable water alongside biogas. For plants where AD alone does not meet direct discharge or reuse limits, the standard polish step is an MBR membrane bioreactor system for post-AD polishing, often paired with a high-efficiency sedimentation tank upstream of the membranes to control TSS loading. The choice of digester is rarely a clean technology decision — it is a feedstock-matching exercise with capex, footprint, and downstream polishing costs riding on the outcome.
Buyer's Decision Framework: Where to Sit Inside the 2026 Growth Curve
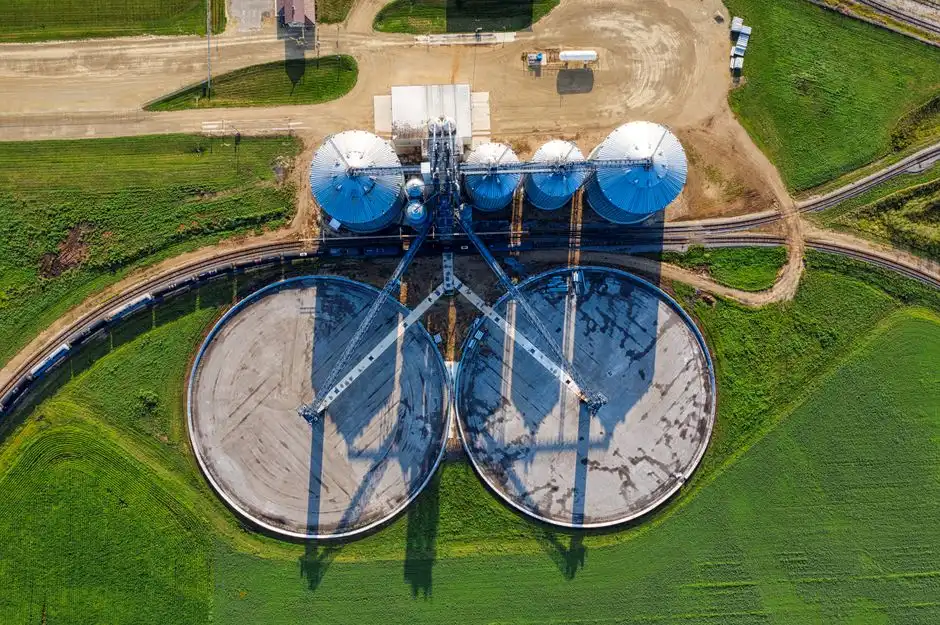
Not every plant should commission an anaerobic digester in 2026, but the ones that should are easy to screen. The economic case carries when four conditions line up: influent COD above 5,000 mg/L, wastewater flow above 50 m³/d, electricity tariff above US$0.10/kWh, and the local grid accepting CHP export. Plants outside those parameters — low-COD streams below 2,000 mg/L, or sub-US$0.08/kWh tariffs — should not lead with AD; they will struggle to carry capex and should instead focus on MBR + RO for water reuse, where the payback sits in the 3–6 year band under most water-scarce conditions.
The matching rule is straightforward: soluble high-COD streams (brewery, distillery, beet-sugar, most food processing) point to UASB or EGSB with HRT measured in hours; particulate high-COD streams (dairy, pulp primary sludge, FOG-rich streams) point to CSTR with pre-thickening via DAF or a rotary drum. Post-AD polishing — almost always required where discharge limits are tight — pairs MBR with downstream RO or a high-efficiency sedimentation tank, depending on the reuse target. The value-proposition frame for the board: in a 5.77% CAGR market, late movers face rising equipment and biomethane-offtake costs, so 2026 is the economic entry point. Pre-AD FOG and suspended solids are handled with a dissolved air flotation system for pre-AD FOG and solids removal; post-AD polishing uses an MBR membrane bioreactor system for post-AD polishing.
| Feedstock profile | Digester choice | Upstream pre-treatment | Downstream polishing |
|---|---|---|---|
| Soluble high-COD (brewery, distillery, beet-sugar, food processing) | UASB or EGSB | Equalization, pH control, nutrient dosing | MBR or sedimentation + DAF |
| Particulate high-COD (dairy, pulp primary sludge, FOG-rich) | CSTR with mixing | DAF or rotary drum thickener | MBR; digestate dewatering via filter press |
| Low-COD or low-tariff sites | Skip AD — focus on reuse | Fine screening | MBR + RO for water reuse |
| High-COD with strict effluent / reuse target | CSTR or EGSB + AnMBR | DAF + nutrient dosing | MBR / RO; reuse loop |
Frequently Asked Questions
What is the CAGR for the biogas-from-wastewater market in 2026?
The waste-derived biogas market is forecast at a 5.77% CAGR for 2026–2034, growing from US$1.92 billion in 2025 to US$3.19 billion by 2034, with a cumulative addressable market of about US$23.12 billion (Verified Market Reports, 2026).
Which wastewater segment is growing fastest?
Industrial wastewater — food, beverage, brewery, dairy, pulp & paper, distillery, and pharma — is the fastest-growing feedstock because it carries 5,000–50,000 mg/L COD and converts to methane at 0.20–0.50 m³ CH₄ per kg VS added, turning a treatment cost into an energy revenue line.
Should a plant prioritise on-site CHP or biomethane grid injection?
For 2026 commissioning, on-site CHP at industrial electricity tariffs of US$0.08–0.14/kWh gives the shortest payback. Grid biomethane injection becomes the larger revenue driver after 2030, particularly under the EU RED III mandate; plants building now should design for CHP with grid-injection-ready gas upgrading as a retrofit.
How do I choose between UASB, EGSB, and CSTR?
Use the rule of thumb: soluble high-COD → UASB or EGSB (HRT 6–24 hours); particulate high-COD → CSTR with pre-thickening (HRT 15–40 days). Footprint, mixing energy, and discharge limits then push the final selection.
What capex should an industrial plant budget for an anaerobic digester?
Industrial-scale CSTR systems typically fall in the US$2,000–6,000 per m³ of reactor band, excluding land, grid interconnect, and CHP. Add pre-AD FOG/solids removal (DAF) and digestate dewatering (plate and frame filter press) to the total installed cost. For site context on sludge handling economics, see the MBR market growth and size 2026 analysis, the decanter centrifuge for distillery wastewater engineering guide, and the landfill leachate COD and BOD removal process guide. For plants in the sewage or landfill-leachate band, an integrated underground sewage treatment system is the adjacent equipment shortlist entry point.