Global Desalination Capacity Hits 120 Million m³/Day in 2026: What the Numbers Mean
Global cumulative desalination capacity is on track to exceed 120 million m³/day by the end of 2026, up from roughly 115 million m³/day at the 2024–2025 baseline. Reverse osmosis accounts for more than 70% of new project awards signed in 2024–2025 contracts, while thermal processes (MSF and MED) hold around 30% of installed capacity, concentrated almost entirely in Gulf-state utilities. Saudi Arabia's published 2030 target of 8.5 million m³/day includes multiple 2026 commissioning milestones that will add to the global installed base. Israel's Sorek plant remains the world's largest SWRO facility at 624,000 m³/day, the design benchmark most new mega-projects are now measured against (see the broader desalination market forecast to 2030).
Industrial users consume approximately 22% of global desalinated water, municipal and potable networks take around 70%, and agricultural or irrigation end-uses account for the remaining 8%. This 22% share is not evenly distributed; power, petrochemical, and mining off-takers in water-stressed basins drive most industrial procurement. China's inland brackish water RO market is expanding at 12–15% CAGR, propelled by zero liquid discharge mandates in coal chemical, power, and lithium battery sectors where dissolved solids in the concentrate stream can no longer be discharged to surface water. For a procurement team reading these numbers, the practical takeaway is that RO is the default technology, and any 2026 RFQ that does not benchmark against SWRO LCOW in the $0.45–0.80/m³ range is operating on stale cost data.
RO vs Thermal vs Hybrid: How the 2026 Technology Mix Is Shifting
Seawater reverse osmosis dominates new builds in 2026 because specific energy consumption has fallen to 2.5–3.5 kWh/m³, driven by isobaric energy recovery devices that have cut consumption roughly in half compared with the 6–8 kWh/m³ of early-2000s plants. Brackish water RO remains the lowest-cost option at $0.20–0.45/m³ LCOW, suited to feedwater in the 1,000–10,000 mg/L TDS range typical of inland aquifers and industrial reuse loops where reject from one process becomes feed for another. Thermal desalination (MSF, MED) is only competitive where waste heat or co-located power generation is available — typical LCOW runs $0.80–1.20/m³ — and remains essentially a Middle East, Red Sea, and Gulf utility play. Forward osmosis and membrane distillation are still pre-commercial in 2026; pilot projects exist in mining and produced water treatment, but full-scale industrial deployment has not reached cost parity with RO.
Technology selection logic in 2026 is straightforward for industrial decision-makers: SWRO is the default for coastal intake, BWRO is the default for inland brackish sources and ZLD pretreatment, and thermal is rarely justifiable unless a free heat source is already on the balance sheet. Solar-thermal and PV-driven hybrid systems are emerging in North Africa and the Middle East, but they carry a 20–40% CAPEX premium over grid-powered RO for the same throughput, so the case must rest on a power purchase agreement that locks in low-cost renewable electricity for 20+ years. Choosing the wrong train is the most expensive mistake an EPC project engineer can make at the feedwater characterization stage.
| Technology | Feedwater TDS (mg/L) | Specific Energy (kWh/m³) | 2026 LCOW ($/m³) | Industrial Fit |
|---|---|---|---|---|
| Seawater RO (SWRO) | 30,000–45,000 | 2.5–3.5 | 0.45–0.80 | Coastal intake — default |
| Brackish RO (BWRO) | 1,000–10,000 | 0.4–1.2 | 0.20–0.45 | Inland reuse / ZLD pre |
| MSF / MED thermal | 30,000–45,000 | 8–14 (heat equiv.) | 0.80–1.20 | Only with waste heat |
| Forward osmosis (FO) | Variable | 0.2–0.5 (draw soln.) | Pre-commercial | Pilot only in 2026 |
| Solar/PV hybrid RO | Any | 2.5–3.5 + PV variability | 0.60–1.10 | Long-term PPA economics |
For procurement, an industrial RO system specified to the operating envelope above will typically be paired with RO pretreatment filtration sized to the feedwater SDI, and an automatic chemical dosing skid for antiscalant and CIP chemistry.
2026 CAPEX and OPEX Benchmarks Industrial Buyers Should Plan Against
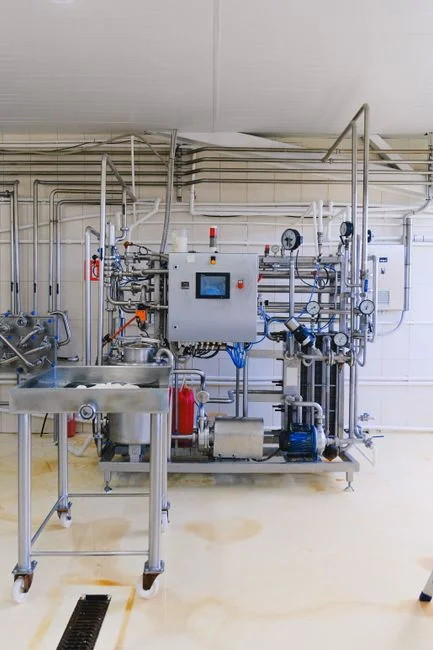
Seawater RO CAPEX in 2026 runs roughly $900–1,800 per m³/day of installed capacity for greenfield plants above 50,000 m³/day; smaller industrial plants in the 5,000–20,000 m³/day range typically fall into a $2,500–4,000 per m³/day band due to diseconomies of scale on intake, outfall, and high-pressure piping. Brackish RO CAPEX is materially lower at $400–900 per m³/day for 10,000–100,000 m³/day plants, reflecting lower pressure ratings, cheaper piping metallurgy, and the absence of seawater-grade corrosion-resistant materials such as super-duplex stainless or fiber-reinforced plastic. These are the numbers a CAPEX committee will sign off against.
On the OPEX side, SWRO breaks down as: energy 30–45%, membrane replacement 10–25%, chemicals 5–10%, labor 10–15%, and maintenance 10–15% — energy remains the dominant lever, which is why a power supply strategy is inseparable from water cost. Concentrate (brine) management now represents 5–15% of total project CAPEX and is the gating constraint for new permits, especially in inland and zero-discharge jurisdictions where evaporation ponds, brine concentrators, or crystallizers must be budgeted as a first-class line item. Industrial-scale plants should plan $0.04–0.12/m³ for membrane replacement over a 5–7 year cycle, with the wide range driven by feedwater quality and CIP discipline. Total SWRO LCOW for a well-operated 2026 plant sits at $0.45–0.80/m³; BWRO LCOW sits at $0.20–0.45/m³ — both ranges assume grid power at $0.05–0.10/kWh.
| Cost Line | SWRO (% of OPEX) | BWRO (% of OPEX) | Industrial Levers |
|---|---|---|---|
| Energy | 30–45% | 25–40% | ERD efficiency, PPA terms |
| Membrane replacement | 10–25% | 10–20% | Feed SDI, CIP frequency |
| Chemicals | 5–10% | 5–10% | Antiscalant selection, dosing |
| Labor | 10–15% | 10–15% | Automation level |
| Maintenance | 10–15% | 10–15% | HP pump rebuild cycle |
| Brine / concentrate | 5–15% of CAPEX | 3–8% of CAPEX | Disposal regulation, ZLD |
An industrial RO system sized against these OPEX lines will keep the energy and membrane replacement categories within the bands above only if the automatic chemical dosing system is specified to maintain antiscalant stoichiometry at design recovery.
Regional Hot Spots Shaping 2026 Desalination Pricing and Sourcing
Middle East and North Africa (MENA) accounts for roughly 40% of global installed capacity, with Saudi Arabia, the UAE, and Israel driving the largest 2026 project pipeline. Chile, Peru, and Australia are the fastest-growing markets in Latin America and Oceania, primarily pulled by mining water demand tied to copper and lithium extraction. China's inland BWRO market operates as a distinct sub-segment: brackish groundwater from the North China Plain is treated for industrial reuse at site scales typically between 5,000 and 50,000 m³/day, with multiple sites aggregated under provincial ZLD programs. Coastal Southeast Asia — Indonesia, Vietnam, the Philippines — is seeing growing SWRO tendering, often co-funded with industrial off-takers in power and petrochemicals that anchor the offtake.
European and North American markets are smaller-volume but high-specification, focused on industrial reuse and produced water from oil and gas rather than municipal supply. From a sourcing perspective, most RO membrane elements are manufactured by a small number of suppliers — DuPont, Toray, LG Chem, and SUEZ/Veolia — which creates a supply concentration risk for 2026 procurement that any industrial buyer should hedge with multi-vendor qualification (additional context in the desalination market forecast to 2030). Lead times on membrane elements in 2025 stretched to 12–16 weeks during peak demand, and that pattern is expected to repeat in late 2026.
What 2026 Industrial Buyers Should Do Differently: A Procurement Framework
- Characterize feedwater first. TDS, temperature, suspended solids, and SDI drive whether SWRO, BWRO, or a hybrid train is appropriate. A 500 mg/L change in feedwater TDS can swing CAPEX by 15–20%.
- Quantify the energy source and cost. A plant with cheap waste heat, a captive power island, or a long-dated solar PPA can change the RO-versus-thermal calculus; otherwise, default to RO with isobaric energy recovery.
- Budget concentrate management as a first-class CAPEX line. Inland projects should plan for evaporation ponds, mechanical brine concentrators, crystallizers, or deep-well injection — not a footnote on page nine of the EPC proposal.
- Negotiate membrane supply terms in advance. Multi-year supply agreements with two to three qualified vendors reduce price volatility across the 5–7 year replacement cycle and protect against the lead-time spikes seen in 2025.
- Insist on a 5-year OPEX model from EPC bidders. Require a breakdown by energy, membranes, chemicals, labor, and maintenance — not a single LCOW number, which hides risk allocation.
Industrial projects under 10,000 m³/day should evaluate skid-mounted modular RO systems for faster delivery (typically 16–24 weeks versus 40+ weeks for stick-built) and lower installed cost. For zero liquid discharge applications, RO is increasingly paired with a brine concentrator and crystallizer; the RO stage alone should still be benchmarked at $0.20–0.45/m³ for BWRO feedwater. This framework aligns with the broader 2026 circular water economy trends shaping industrial CAPEX approvals, and it complements the electrodialysis OPEX breakdown for hybrid trains that use ED as a polishing step ahead of RO.
Frequently Asked Questions
What is the global desalination capacity in 2