What Drives Electrodialysis Spare Parts and Consumables Cost
Ion-exchange membranes dominate electrodialysis spare parts and consumables cost at $100–$150 per m² of installed area (Generous et al. 2021 baseline, still cited in 2026). They represent roughly 45–55% of lifetime consumables over 10 years. On a 1,000 m³/d ED or EDR plant, annual consumables and spares typically equal 8–14% of CAPEX, with membranes about half of that spend.
Consumables are process-consumed items — ion-exchange membranes, electrode coatings, cleaning acids and caustics, and antiscalants. Spare parts fail mechanically or electrically: pumps and seals, rectifier modules, spacer/gasket sets, valves, sensors, and gauges. Most 2021–2025 techno-economic studies blur the two, so a 2026 budget often cannot separate a recurring line from a one-time reserve.
The 2026 US industrial electricity baseline sits at $0.10–$0.12/kWh (US EIA industrial average, 2026-Q1 release). At 0.4–0.6 kWh/m³ specific energy, power still dominates absolute OPEX. The consumables reserve remains the line procurement can actually negotiate.
Anatomy of an ED/EDR Stack: Parts You Will Replace
An industrial electrodialysis stack is a repeating sandwich of one AEM, one CEM, and one spacer. That sandwich repeats 100 to 600 times per stack depending on capacity. A 1,000 m³/d brackish plant typically carries 600–1,000 m² of installed membrane area, split roughly 50/50 between AEM and CEM. The cell pair is the replaceable unit; everything outside it is balance-of-plant.
End-plates carry the electrodes, and material choice follows the feed. Ti/MMO is standard for chloride-bearing brackish and chlor-alkali brine. Ti/Pt is reserved for high-current or high-pH service. Graphite anodes still appear on sulfate-rich food and dairy duty.
End-plates rarely fail over the unit life, but electrode coatings do. Balance of plant includes the rectifier and DC bus, circulation and electrode-rinse pumps, gauges, conductivity and pH probes, flow switches, valves, and the frame. Failures concentrate at pumps and seals, rectifier modules, and — in EDR — reversal valves and polarity-rated contactors.
EDR (Electrodialysis Reversal) matches conventional ED on the membrane side, but polarity swap adds two to four electrically rated solenoid valves, a contactor, and a polarity-rated DC bus. Those incremental spares drive 25–40% higher annual consumables spend than conventional ED on the same feed. For feed pre-treatment comparison, an industrial RO system for feed pre-treatment comparison is often co-specified with ED/EDR on the same project BOQ.
What Does a Water Treatment Plant Cost Breakdown Look Like for ED?
Every figure below is 2026 list pricing drawn from Generous et al. 2021 as the baseline and adjusted for the +5–10% membrane inflation observed since 2022. Specialty PFAS- and monovalent-selective grades track higher, per HydropureWater procurement records, 2026-Q1. Replacement reserve is the annualized line a procurement lead should book each year of a 5-year plan.
| Component | 2026 unit cost | Typical lifetime | Annual replacement reserve |
|---|---|---|---|
| Ion-exchange membranes (AEM + CEM) | $100–$150/m² (specialty: $180–$260/m²) | 3–7 years | (membrane area × cost) / lifetime |
| Ti/MMO electrodes (anode/cathode pair) | $1,200–$2,800/m² installed | 4–8 years; recoat at 30–50% of new | ~12–25% of installed cost per year |
| Spacers and gaskets | $20–$60/m² of membrane area | Every membrane rebuild | Booked with membrane reserve |
| Feed/brine/electrode-rinse pumps | $4,000–$18,000 per centrifugal unit | 7–12 years; seals 1–3 years | $1,000–$3,000 per pump-year |
| Rectifier and DC controls (industrial) | $15,000–$80,000 | 10–15 years; thyristor/IGBT modules 5–10 years | $1,500–$8,000 per year |
| Cleaning chemicals (HCl, NaOH, CIP additives) | $0.005–$0.02 per m³ treated | Consumable — full annual use | $1,800–$7,300 per year (1,000 m³/d) |
| Antiscalant | $0.002–$0.008 per m³ treated | Consumable | $700–$2,900 per year (1,000 m³/d) |
| Sensors, probes, reversal valves (EDR) | $1,500–$6,000 per year | 1–5 years | Annual line |
Cleaning chemicals and antiscalant scale with throughput; membranes, electrodes, and spacers scale with installed area. Instrumentation is the line most operators under-budget. Instrument-air solenoid replacement on EDR valves is the single most common hidden spend and should be tracked with the same discipline as membrane replacement. For chemical feed, an automatic chemical dosing for ED CIP and antiscalant setup reduces chemical waste 10–15% versus manual dosing and is usually paid back inside 18 months on a 1,000 m³/d plant.
ED vs EDR vs Bipolar Membrane: How Configuration Changes the Bill
ED, EDR, and BMED look similar on a P&ID, but consumables economics diverge once reversal cycles or a third membrane layer enter the picture. EDR costs 25–40% more in annual consumables than conventional ED on the same feed because polarity swaps accelerate membrane and electrode wear.
EDR also halves cleaning chemical consumption and extends CIP interval from weekly to monthly on most brackish feeds. On variable-quality feeds — industrial brine, food/dairy whey, oil-field produced water — EDR net OPEX is often lower than conventional ED. On steady, low-fouling NaCl brine, conventional ED remains the lowest-consumables option.
Bipolar-membrane electrodialysis (BMED) is the most consumables-intensive ED variant. It carries a third membrane type (bipolar membrane at $180–$260/m²) used for acid/base recovery — for example, converting Na₂SO₄ into NaOH and H₂SO₄. BMED only pencils out when the displaced chemical cost is real, typically $80–$200/tonne of acid or base recovered. Treat BMED as a chemical-replacement project, not a desalination project.
| Parameter | Conventional ED | EDR (Reversal) | BMED (Bipolar) |
|---|---|---|---|
| Membrane cost per m² | $100–$150 | $100–$150 | $180–$260 (bipolar layer) |
| Annual consumables vs ED baseline | 1.0× (reference) | 1.25–1.40× | 1.6–2.0× |
| Cleaning chemical use | Baseline | ~50% of ED | Similar to ED |
| CIP interval on brackish feed | Weekly | Monthly | Weekly |
| Best-fit feed | Steady, low-fouling | Variable-quality, scaling-prone | Salt-split, acid/base recovery |
| Hidden spares cost driver | Electrode recoat | Reversal valve solenoids | Bipolar membrane replacement |
What Shortens Membrane and Electrode Life

Three failure modes account for most premature ED consumables spend. Scaling from CaSO₄ and CaCO₃ on the concentrate side cuts membrane life from 6+ years to 2–3 years when LSI is not controlled. The forced membrane replacement costs roughly 10× the antiscalant that would have prevented it.
Organic fouling from humics, oils, and surfactants drives CIP frequency and chemical OPEX. DAF pre-treatment to cut ED membrane fouling typically reduces CIP chemical consumption by 30–45% on food, dairy, and refinery feeds. Chlorine and oxidizer attack is the most common cause of premature AEM replacement; hold feed ORP below 0.2 mV (HydropureWater commissioning data, 2025) before the stack.
Operating current density is the lever operators most often get wrong. Running above rated current density (typically 300–500 A/m² for brackish service) shortens electrode coating life by 30–50% and accelerates membrane blistering. Most plants we size for brackish duty run at the lower end of that band in practice. Design and operate at 70–80% of the nameplate limit; the small loss in throughput per cell is paid back many times in deferred electrode recoating and avoided membrane change-outs.
How Does Spare Parts OPEX Compare to Energy on a 1,000 m³/d Plant?
Spare parts OPEX on a 1,000 m³/d brackish ED plant with about 800 m² installed membrane area typically rivals energy on a per-m³ basis. Specific energy is 0.5 kWh/m³ at $0.10/kWh. The table below books annual replacement reserves, not cash out. Actual cash is lumpy — membranes every 5 years, electrodes every 6, pumps every 8–10 — but the reserve is what the budget must absorb.
| Line item | Annual reserve (USD) | Per-m³ cost | Notes |
|---|---|---|---|
| Membrane replacement reserve | $11,000–$24,000 | $0.030–$0.066 | 5-year cycle at $100–$150/m² |
| Electrode recoat / replacement reserve | $3,000–$7,000 | $0.008–$0.019 | 6-year cycle, Ti/MMO |
| Cleaning chemicals (HCl, NaOH, CIP) | $2,000–$5,000 | $0.005–$0.014 | Weekly CIP on brackish feed |
| Antiscalant | $700–$2,900 | $0.002–$0.008 | Threshold inhibitor dosing |
| Spacers, gaskets (rebuild consumables) | $1,500–$3,500 | $0.004–$0.010 | Booked with membrane cycle |
| Pump seals and mechanical faces | $1,000–$3,000 | $0.003–$0.008 | 1–3 year interval |
| Rectifier spares (modules, contactors) | $1,500–$4,000 | $0.004–$0.011 | 5–10 year module life |
| Sensors, probes, EDR valves | $2,000–$4,000 | $0.005–$0.011 | Annual line |
| Total consumables and spares | $22,700–$53,400 | $0.06–$0.15 | Excludes energy |
| Energy (0.5 kWh/m³ at $0.10/kWh) | $18,250 | $0.05 | Add separately |
Total consumables and spares land at $0.06–$0.15 per m³, while energy at this duty is about $0.05 per m³. Membrane replacement cycle and cleaning chemicals are the two biggest variable lines. Doubling membrane life from 5 to 10 years cuts per-m³ consumables by roughly 30%.
Halving CIP frequency via better pre-treatment or EDR reversal typically saves another 20–25%. For an adjacent cost view, the 2026 OPEX breakdown for adjacent treatment stages helps sanity-check downstream chemical and energy lines.
What to Stock: A Practical ED/EDR Spares Holding List
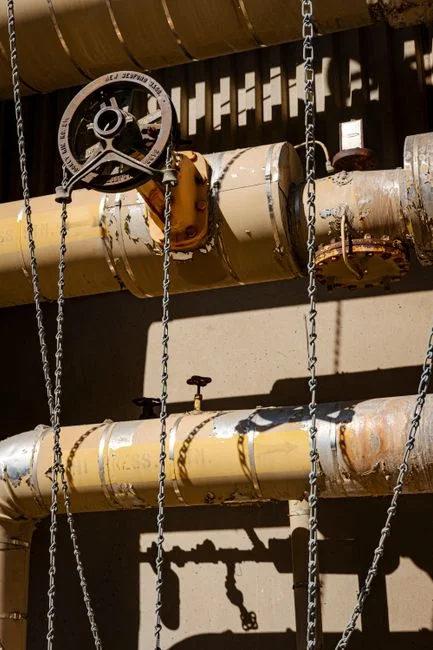
Build the holding list around two tiers. Always-stock items stop the plant when they fail: two spare membrane cell-pairs per stack size, one full gasket set, one electrode assembly, one seal kit per service pump, and one year of CIP chemicals.
Recommend-stock items carry multi-week lead times: one spare rectifier module, one conductivity probe, and — for EDR only — reversal valve solenoids plus one polarity-rated contactor. For valves, media, and common balance-of-plant hardware, Water Treatment Parts, Valves & Filter Media covers the non-membrane items most plants under-order.
Selection checklist before you freeze the 5-year reserve:
- Confirm AEM/CEM area (m²) and expected lifetime under your feed LSI and ORP limits.
- Choose ED vs EDR vs BMED against feed variability and whether acid/base recovery has a real displaced-chemical value.
- Book electrode recoat at 30–50% of new Ti/MMO cost on a 4–8 year cycle.
- Hold one year of CIP chemicals plus threshold antiscalant for design throughput.
- Stock seal kits for every service pump and, on EDR, a full solenoid/contactor set.
- Order specialty membranes 8–14 weeks ahead; standard AEM/CEM lead times are 6–10 weeks since 2024.
- Cap operating current density at 70–80% of nameplate (typically 300–500 A/m² brackish).
Specialty membranes (PFAS-selective, monovalent-selective, bipolar) carry 8–14 week lead times in 2026. Standard AEM/CEM lead times have crept to 6–10 weeks since 2024. Order replacement membranes six months ahead of scheduled change-out.
Holding critical-path spares on-site is cheaper than an unplanned shutdown on a 1,000 m³/d line. Where feed variability makes ED membrane holding hard to justify, nanofiltration as an alternative or pre-step to ED is worth modelling.
Who This Is For / Next Step
Plant engineers, EPC contractors, and procurement leads sizing a 5-year OPEX reserve for ED or EDR are the audience for this breakdown. Teams chasing only lowest CAPEX, or feeds that need RO rejection rather than salt-split recovery, should look elsewhere. If you need a stack-specific spares list matched to feed chemistry and current density, request a quote with your flow, TDS, and stack area and we will map the annual reserve line by line.
Frequently Asked Questions
How much do electrodialysis membranes cost in 2026?
Standard ion-exchange membranes list at $100–$150/m² (Generous et al. 2021 baseline, with +5–10% inflation reflected in 2026 list pricing). PFAS- and monovalent-selective grades run $180–$260/m². Bipolar membranes for BMED also run $180–$260/m². On a 1,000 m³/d plant with 600–1,000 m² installed, that membrane band alone sets most of the multi-year consumables reserve.
How often do ED membranes need replacement?
ED membranes typically need replacement every 3–7 years depending on feed. Clean NaCl brine with controlled LSI often reaches 6+ years. Scaling-prone feeds without antiscalant fall to 2–3 years. Typical brackish water with proper pre-treatment lands in the 3–5 year band for most plants we commission.
What is the most expensive ED consumable?
The membrane stack is the most expensive ED consumable. At $100–$150/m² and 600–1,000 m² of installed area on a 1,000 m³/d plant, membranes represent 45–55% of lifetime consumables spend. Electrodes and CIP chemicals follow, but neither approaches the membrane share on a 10-year horizon.
Is EDR more expensive to maintain than conventional ED?
Yes — EDR consumables run 25–40% above conventional ED on the same feed because reversal cycles accelerate membrane and electrode wear. EDR also halves cleaning chemical use and extends CIP interval from weekly to monthly on most brackish feeds. On variable-quality feeds that net OPEX is often lower despite the higher spares bill.
How can I reduce ED spare parts cost?
Hold feed ORP below 0.2 mV, dose threshold antiscalant rather than running on LSI alone, and design at 70–80% of nameplate current density. Pre-treat organics with multi-media filtration upstream of the ED stack or, for oily feeds, electrocoagulation as an ED pre-treatment for refinery duty. Each lever typically extends membrane life 30–50% when applied to the matching foulant.
Related Equipment
- DAF pre-treatment to cut ED membrane fouling — specifications, capacity range, and technical data