What 'AOP System Maintenance Cost' Actually Covers
AOP system maintenance cost in 2026 typically runs $0.04–$0.22 per cubic meter of treated wastewater, or 3–8% of CapEx annually, depending on the AOP technology. Fenton processes are cheapest to maintain ($0.04–$0.08/m³) while ozone-based and UV/H2O2 systems sit at the higher end ($0.12–$0.22/m³) due to electrode and lamp replacement. That single number, however, hides the four buckets finance will eventually ask you to defend line by line.
Engineers who budget accurately separate advanced oxidation process OPEX into four cost buckets:
- Energy — UV lamp wattage, ozone generator kWh/kg O3, dosing-pump draw, cooling water pumps, and control instrumentation. Energy typically runs 15–30% of total AOP OPEX for ozone and UV systems, and under 10% for Fenton.
- Consumables — H2O2 (30–50% solution), FeSO4·7H2O or other iron catalysts, O2 feed for ozone generators, NaOH for pH adjustment and quenching, H2SO4 for acidification, and TiO2 slurry for photocatalytic reactors. Consumables are usually 40–60% of OPEX.
- Spare parts — UV lamps, quartz sleeves, ozone electrodes and dielectric tubes, PSA O2 membranes, dosing-pump diaphragms, ORP/pH sensors, gaskets, and catalyst carriers. Plan 10–20% of OPEX here.
- Labor — preventive routines (calibration, sensor swap, lamp cleaning) plus corrective work. Budget 2–6 hr/week per skid at $35–$70/hr fully loaded (HydropureWater field data, 2026).
Two scoping rules prevent the budget from being wrong before it starts. First, isolate the AOP skid only — AOP rarely treats raw influent, so cost accounting should stop at the AOP inlet and outlet rather than blending biological-stage OPEX into the number. Second, split preventive from corrective work. A well-run AOP keeps preventive ≥70% of the maintenance envelope; corrective above 30% is a leading indicator of unplanned downtime (typically 4–12 hr per event, per HydropureWater field data, 2026).
2026 OPEX Benchmarks by AOP Technology
OPEX for the four mainstream industrial AOP technologies varies by a factor of 3–4× per cubic meter, driven almost entirely by whether the system consumes a consumable (H2O2, catalyst) or a replaceable hardware item (UV lamp, O3 electrode). The table below lets a procurement lead benchmark a vendor quote against 2026 industry-typical ranges before signing the PO.
| AOP Technology | OPEX Range ($/m³) | Dominant Cost Driver | Typical Reagent / Hardware Dose |
|---|---|---|---|
| Fenton / photo-Fenton | $0.04–$0.08 | H2O2 + FeSO4 | H2O2 0.5–2.0 g/L; Fe:H2O2 1:5 to 1:10 wt |
| Ozone-based (O3, O3/H2O2, O3/UV) | $0.12–$0.22 | Electricity + electrode replacement | 8–14 kWh/kg O3; electrode swap 12–24 mo |
| UV/H2O2 | $0.10–$0.18 | Lamp replacement + H2O2 | H2O2 0.5–2.0 g/L; lamps 8,000–12,000 hr |
| Photocatalytic (TiO2/UV) | $0.08–$0.15 | TiO2 media replacement + UV | TiO2 media swap every 2–4 yr |
Fenton and photo-Fenton sit at the low end because the hardware is mostly civil — a reaction tank, a dosing skid, and a settler. Spend tracks H2O2 and FeSO4 price-per-liter, both of which are commodity chemicals. Ozone and UV/H2O2 carry hardware replacement cycles that show up on the maintenance schedule whether the chemistry is running or not, which is why a 1,000 m³/d UV/H2O2 skid typically pencils $100k–$180k/yr in OPEX against $40k–$80k/yr for an equivalent Fenton duty (HydropureWater field data, 2026).
Photocatalytic AOP falls in the middle: the TiO2 itself is cheap per kg, but replacing a coated-media reactor bed every 2–4 years is a planned capex event most budgets miss. Two caveats apply to all four rows. First, feed COD, target removal percentage, and required log reduction of micropollutants drive ±40% variance from the midpoint. Second, readers comparing AOP to upstream biology should anchor against the MBBR operating cost benchmark of $0.06–$0.18/m³ — AOP OPEX is competitive with MBBR only when the upstream biology is already optimized.
Consumables Cost Breakdown: H2O2, Catalysts, and Quench Chemicals
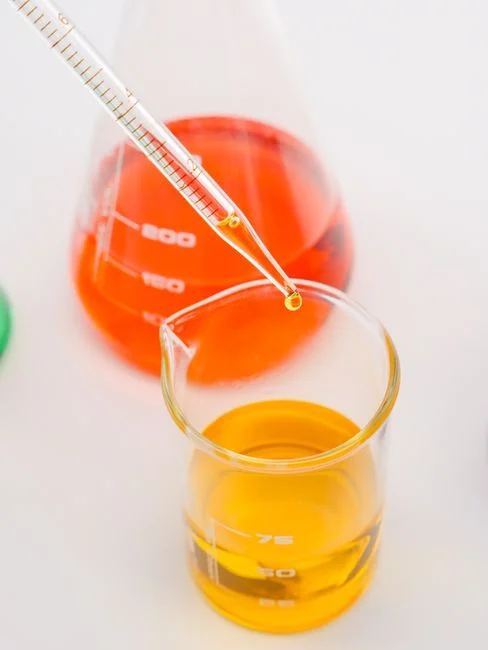
Consumables are the line item finance scrutinizes most because it scales linearly with flow. The 2026 unit prices below convert stoichiometry into annual chemical spend without a vendor quote in hand.
| Consumable | 2026 Unit Price | Typical Dose | Notes |
|---|---|---|---|
| H2O2 30% bulk delivered | $0.35–$0.70/L | 0.5–5.0 g/L (as 100%) | 5–10% annual price drift; bulk >5,000 L/mo saves 15–25% |
| FeSO4·7H2O catalyst | $0.15–$0.30/kg | Fe:H2O2 1:5 to 1:10 wt | Photo-Fenton uses 20–40% less Fe than dark Fenton |
| NaOH (50% or beads) | $0.20–$0.45/kg | For pH adjustment + H2O2 quenching | Quench stoichiometry ≈ 0.5 kg NaOH per kg residual H2O2 |
| H2SO4 98% | $0.10–$0.25/kg | Lower pH to 2.5–4.0 for Fenton | Bulk supplier pricing common in 2026 |
| TiO2 anatase nano-grade | $2.50–$6.00/kg | 0.1–1.0 g/L slurry, or coated media | Coated media priced per m² of reactor, not per kg |
| O2 feed for ozone generator | $0.04–$0.09/m³ | ~10 Nm³ O2 per kg O3 generated | PSA or LOX; LOX cheaper above 50 kg O3/d |
Worked example: 500 m³/d effluent, COD 800 mg/L, target 70% removal. Stoichiometric H2O2 demand is ≈1.0 g H2O2 per g COD removed, which lands at a working dose of 1.5 g/L once you account for scavenging and side reactions. That is 750 L/d of 30% H2O2 → $260–$520/d in oxidizer alone, or $95k–$190k/yr. Add FeSO4 at a 1:7 Fe:H2O2 mass ratio (~107 kg/d → $16–$32/d) and a Fenton skid at this duty is spending $100k–$220k/yr on consumables. The same duty on UV/H2O2 typically spends 20–35% less on chemicals because lamp-driven ·OH generation is more selective, but adds $15k–$25k/yr in lamp replacement (HydropureWater field data, 2026).
Spare Parts and Replacement Schedules
AOP spare parts are dominated by items that degrade on a known duty cycle. Hand the table below to a maintenance planner and the lamp-swap and electrode-swap windows stop being surprises.
| Spare Part | Unit Price (2026) | Replacement Interval | Failure Mode |
|---|---|---|---|
| UV lamp (low-pressure Hg, 30–60 W) | $180–$450 each | 8,000–12,000 hr (≈12–18 mo) | Output drops below 70% of nameplate |
| Quartz sleeve | $60–$120 each | 2–3 yr or on fouling | Fouling, scaling, breakage |
| Ozone generator electrode / dielectric tube set | $1,200–$3,500 per set | 12–24 mo | Dielectric breakdown, arcing |
| PSA O2 membrane module | $400–$900 | 3–5 yr | Compaction, O2 purity drop |
| Dosing pump (H2O2, FeSO4, NaOH) | $350–$1,800 each | 5–10 yr body; diaphragm kits $40–$90 every 6–12 mo | Diaphragm fatigue, leak |
| ORP / pH / H2O2 residual sensor | $400–$1,200 each | 12–24 mo | Drift, reference junction fouling |
| Catalyst carrier (fixed-bed Fenton, TiO2 media) | $800–$2,500 per m³ of reactor | 3–5 yr | Attrition, poisoning |
Attrition is the leading degradation mode for fixed-bed Fenton and TiO2 carriers — fluidization and backwash cycles slowly grind media, and a 10–20% top-up per year is normal between full bed replacements (HydropureWater field data, 2026). For UV skids, batch-replacing lamps on a planned schedule (rather than waiting for burnout) saves the 20–40% emergency-callout premium and eliminates the failure mode where one lamp out trips a UV-intensity interlock and shuts the skid down.
Labor, Energy, and Hidden Costs
The soft costs in an AOP budget routinely exceed 25% of OPEX once energy, labor, and disposal are tallied honestly. Labor runs 2–6 hr/week for routine checks per skid — calibration, sensor swap, lamp cleaning, and H2O2 drum changeover. A skilled automation or chemistry technician is $35–$70/hr fully loaded in 2026, which lands labor at $4,000–$22,000/yr per skid depending on automation level.
Energy share depends on the technology. UV lamps draw 30–60 W each and a 1,000 m³/d UV/H2O2 skid typically runs 40–80 lamps. Ozone generators consume 8–14 kWh/kg O3 and dominate the energy line on O3-AOP. Cooling water pumps add 0.5–2 kW per skid. On ozone systems, energy reaches 25–30% of OPEX; on Fenton, it stays under 10%.
Hidden costs are where most budgets fail. Fenton generates an iron-laden chemical sludge that often doubles downstream solids loading — disposal at $50–$150 per wet ton erodes the Fenton OPEX advantage. Ozone systems need an off-gas destructor (catalytic or thermal) at $4,000–$12,000 capex and $200–$500/yr in catalyst media. H2O2 storage requires ventilation, secondary containment, and safety compliance that small plants underestimate by 30–50%. Downtime is the line item that finance cares about most: an unplanned AOP outage often halts the upstream biological stage, so the value of lost production ($/hr) should be multiplied by mean time-to-repair and added to the lifecycle model. The same consumable-plus-spare-plus-labor pattern that drives the filter press budget (see the filter press consumables cost framework) applies here, with the AOP layer adding energy intensity on top.
10-Year Lifecycle Cost Model for an AOP Skid
The 10-year number is what finance will actually approve against. Use a reference 1,000 m³/d UV/H2O2 AOP skid as the worked case, then compare against an equivalent Fenton duty. All figures in 2026 USD; validate against current vendor quotes before commitment.
| Line Item | UV/H2O2 Skid (1,000 m³/d) | Fenton Skid (1,000 m³/d) |
|---|---|---|
| CapEx (reactor + UV train + dosing + control) | ~$250,000 | ~$150,000 |
| Energy (annual) | ~$8,000 | ~$3,000 |
| H2O2 (annual) | ~$22,000 | ~$15,000 |
| Catalyst (FeSO4, annual) | n/a | ~$5,000 |
| UV lamps / electrodes (annual) | ~$6,000 | n/a |
| Labor (annual) | ~$10,000 | ~$7,000 |
| Spares, sensors, misc (annual) | ~$4,000 | ~$2,000 |
| Total annual OPEX | ~$50,000 | ~$30,000 |
| 10-year OPEX | ~$500,000 | ~$300,000 |
| 10-year total cost of ownership | ~$750,000 | ~$450,000 |
The sensitivity that matters: every 1 g/L reduction in working H2O2 dose (driven by better upstream pre-treatment) saves roughly $50k/yr at 1,000 m³/d. That single lever dwarfs the cost of polishing the biological effluent with a DAF pre-treatment or an MBR membrane bioreactor upstream. Pairing the AOP OPEX optimization with predictive maintenance sensors typically cuts unplanned downtime 30–50%, which on a $5,000/hr value-of-lost-production plant is worth more than the sensor capex in the first quarter.
How to Reduce AOP Maintenance Cost Without Sacrificing Performance
Five actions consistently move AOP OPEX by 15–30% within a single budget cycle:
- Optimize upstream pre-treatment. A sand filter, DAF, or MBR polishing the biological effluent can cut H2O2 dose 20–40% by stripping suspended solids that scavenge ·OH radicals.
- Install VFDs on dosing and recirculation pumps. Matching pump turndown to actual flow eliminates over-dosing at partial load — a common 10–20% waste stream in 24/7 plants with diurnal flow.
- Use online H2O2 residual and ORP sensors in closed loop. Manual set-point control typically over-doses by 15–30%; an automatic chemical dosing system with feedback closes that gap.
- Negotiate bulk H2O2 supply. Tank delivery above 5,000 L/mo runs 15–25% cheaper per liter than drums, and removes drum-handling labor.
- Replace UV lamps in planned batches. Group lamp swaps to a single annual shutdown instead of running-to-failure, avoiding the 20–40% emergency premium and the UV-intensity trip events that follow single-lamp burnout.
Frequently Asked Questions
What is a typical AOP system maintenance cost per cubic meter in 2026? Industrial AOP maintenance runs $0.04–$0.22/m³ of treated wastewater in 2026, with Fenton at the low end ($0.04–$0.08) and ozone or UV/H2O2 at the high end ($0.12–$0.22) (HydropureWater field data, 2026).
What percentage of CapEx does AOP maintenance cost per year? Annual AOP maintenance typically equals 3–8% of CapEx, so a $250,000 skid budgets $7,500–$20,000/yr as a sanity-check floor before the OPEX stack is built up.
How much does an ozone generator electrode replacement cost? A full electrode and dielectric tube set runs $1,200–$3,500 in 2026 and is replaced every 12–24 months of continuous duty, which is the largest single line item on an O3-AOP spare-parts budget.
How often do UV lamps need replacement in an AOP skid? Low-pressure Hg UV lamps in AOP service are rated for 8,000–12,000 hours, or approximately 12–18 months of continuous duty, with a 2026 unit price of $180–$450 each depending on wattage and arc length.
What is the largest consumable cost in a Fenton AOP? Hydrogen peroxide at $0.35–$0.70/L for 30% solution is the dominant Fenton OPEX line, typically 60–75% of total consumable spend at industrial COD loadings, with FeSO4 catalyst at $0.15–$0.30/kg as the secondary line.
Related Equipment
- MBR membrane bioreactor — specifications, capacity range, and technical data