Why 2026 Is the Compliance Tipping Point for Industrial Microplastic Discharges
Four overlapping regulatory windows close between 2026 and 2030, and any plant that waits past Q4 2026 to map its exposure will be retrofitting under consent-order pressure. EU REACH Annex XVII has restricted intentionally added microplastics since October 2023, with use-phase derogations expiring on a rolling schedule through 2029 — meaning a textile or coatings plant that sources a restricted polymer additive in 2027 cannot use existing stocks after its specific derogation sunset. The EU Urban Wastewater Treatment Directive (2024/3019) obliges monitoring at plants ≥100,000 PE from 2030, but the methodology must be proven by 2026, so engineering decisions made this year will lock in hardware choices for the next 25 years.
China's GB 18918-2024 added microplastic monitoring to municipal WWTPs in 2024 and is scheduled to extend to industrial discharge categories in the 2026–2027 revision cycle, with a draft 200 particles/L guidance threshold circulating in the GB/T measurement working group. In the U.S., no federal industrial limit exists, but the closest numerical precedent is the 0.5% w/w inert-component cap found in state compost quality regulations — a limit originally drafted for solids, not water, but already cited by EHS auditors as a benchmark for industrial "best available technology." The OECD/G20 2024 Osaka Blue Ocean Vision review proposed a 10 particles/L "no-effect" discussion benchmark for receiving waters; while non-binding, multinationals with EU exposure are already writing it into supplier codes.
The compressed window forces a 2026 decision: plants that baseline now can stage MBR and UF retrofits across two capex cycles; plants that wait until 2028 will face simultaneous source-control, treatment, and monitoring mandates with no engineering slack.
How Microplastics Are Measured — And Why Your Number Depends on the Method
Three incompatible units circulate in 2026 compliance documents, and a single effluent sample can read as compliant in one and non-compliant in another. The particles/L metric — the most common in EU and China working drafts — relies on visual or FT-IR counting of fragments ≥20 µm; Gkika et al. (2023) reported 140–340 particles/L in WWTP secondary effluent using this method. The fibres/m³ metric, used in Bäuerlein et al. (2023) and Dutch surface-water studies, returned 1,000–2,000 fibres/m³ on the same effluent class because it captures elongated particles at lower size thresholds. The mass-based ng/L or µg/L metric — proposed at 30 mg/L for industrial discharge by Lechner (2015) — never became law, but remains in use at sites running pyrolysis-GC/MS validation.
Spectroscopy choice adds another order of magnitude. FT-IR has a detection floor near 20 µm and undercounts small fragments; Raman spectroscopy reaches 10 µm and routinely reports 2–3× the FT-IR particle count on the same grab sample. Pre-2026 regulations still distinguish microbeads (intentionally added, spherical, used in cosmetics and abrasives) from secondary fragments and fibres — EU REACH Annex XVII targets the first category, leaving fragment and fibre discharges largely unregulated at the product level even though they dominate industrial loads. Any compliance certificate filed in 2026 must specify both the unit (particles/L or fibres/m³) and the analytical method (FT-IR ≥20 µm or Raman ≥10 µm); a number without that context is not defensible to an inspector.
Global Microplastics Discharge Limits for Industry: 2026 Status by Jurisdiction
No single global microplastics discharge limit for industry exists in 2026. The EU regulates intentionally added microplastics under REACH (in force since October 2023) but has not yet set a numerical effluent limit; the U.S. EPA has no federal industrial limit, though California (AB 2227) and New York restrict microbeads. China GB 18918-2024 added microplastic monitoring but no enforceable mass limit. Industrial plants typically see 140–340 particles/L and 1,000–2,000 fibres/m³ in WWTP effluent, requiring MBR + UF or ozonation to reach any forthcoming 10 particles/L benchmark.
The table below consolidates the enforceable and draft status by jurisdiction as of mid-2026.
| Jurisdiction | Legal instrument | Status (2026) | Numerical limit / benchmark | Scope |
|---|---|---|---|---|
| EU | REACH Annex XVII (2023) | In force; derogations 4–6 yr | Restriction on intentional use; no effluent number | Manufacturers/importers ≥1 t/yr |
| EU | UWWTD 2024/3019 | Monitoring from 2030; method pilot 2026 | No number yet; method mandate | Plants ≥100,000 PE |
| U.S. (federal) | — | None | — | — |
| California | AB 2227 (2022) | In force | Microbead ban in rinse-off products | Product, not effluent |
| New York | S5029-A (2023) | In force | Microbead prohibition + reporting | Product + manufacturer reporting |
| U.S. (state benchmark) | Compost quality regs | In force | 0.5% w/w inert component (solids reference) | Compost, cited by auditors |
| China | GB 18918-2024 | In force; industrial extension 2026–2027 | Draft 200 particles/L guidance | Municipal now; industrial pending |
| Malaysia | DOE 2024 effluent update | In force; Malaysia Standard B pending | ≤200 particles/L expected | Industrial discharge to river |
| Singapore | NEA / PUB guidance | Follows EU monitoring model | No number yet | Industrial via trade effluent rules |
| Thailand | PCD notification | Monitoring voluntary | No number yet | Selected industrial sectors |
| WHO | Guidance 2023 | Advisory | No industrial limit; 0.001 particles/L DW target | Drinking-water reference only |
ECHA's 2024 restriction proposal extends reporting to any manufacturer placing ≥1 tonne/yr of a microplastic-containing preparation on the EU market, pulling in contract manufacturers outside the bloc. ASEAN regulators — Malaysia DOE, Singapore NEA, Thailand PCD — are tracking EU UWWTD rather than U.S. EPA, so a plant with EU exports should anchor its monitoring protocol to the EU template, not the looser U.S. state patchwork.
Treatment Train Performance: What Actually Removes Microplastics from Industrial Effluent
Removal performance varies by an order of magnitude depending on where the barrier sits in the train. A coarse screen removes 5–15% of large fragments but is blind to fibres below 300 µm (Gkika et al., 2023). A primary clarifier paired with a dissolved air flotation (DAF) system operating at 4–25 m³/h surface loading skims buoyant polyethylene and polypropylene fragments, lifting total removal to 20–35% — a useful first step for plastic-pellet operations where the polymer density is below 1.0 g/cm³.
Conventional activated sludge (CAS) achieves 70–85% particle removal through bioflocculation but its effluent still carries 50–150 particles/L because the floc surface cannot retain long, flexible fibres. An MBR membrane bioreactor system with 0.1 µm PVDF membranes closes that gap to 90–95% removal and an effluent of 10–30 particles/L — the lowest-effort compliance option for a plant already running biological treatment. Adding UF or MF polishing at 0.01–0.1 µm pushes removal past 99% (1–5 particles/L), the level required if the OECD 10 particles/L benchmark hardens into an enforceable limit. Ozonation coupled with AOP at 5–10 mg/L O₃ and 0.5–1 g O₃/g DOC degrades residual fibres below Raman detection, achieving 99.9% total reduction — but at a 20–30% CAPEX premium over UF.
| Treatment step | Typical removal (%) | Effluent particles/L | CAPEX index (1.0 = MBR) |
|---|---|---|---|
| Coarse screen (1–6 mm) | 5–15 | 300–600 | 0.1 |
| Primary clarifier + DAF | 20–35 | 200–400 | 0.4 |
| CAS (conventional activated sludge) | 70–85 | 50–150 | 0.7 |
| MBR (0.1 µm PVDF) | 90–95 | 10–30 | 1.0 |
| UF/MF polish (0.01–0.1 µm) | 99–99.5 | 1–5 | 1.4 |
| Ozonation + AOP | 99.9 | <1 | 1.6 |
The decision logic for an EHS manager is straightforward: if your baseline exceeds 200 particles/L, DAF and CAS will not get you to a draft Chinese standard; MBR is the minimum; if your customer or sector benchmark is 10 particles/L, plan UF or AOP polish from day one of the retrofit.
Industrial Sector Hotspots: Where Microplastic Loads Originate
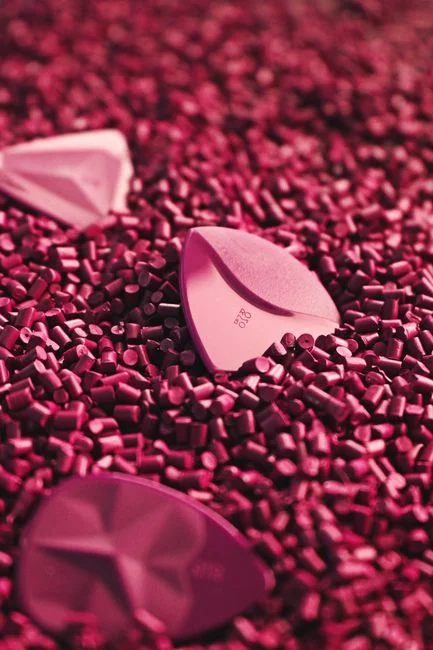
Source profile dictates the treatment train. Plastic-pelletizing and resin production is the highest-intensity point source: process water routinely carries up to 10⁶ particles/L pre-treatment, which is why Operation Clean Sweep voluntary programmes target this sector — a single captured pellet per minute across a plant fleet prevents billions of particles per year. Textile manufacturing is the second hotspot; polyester and polyamide microfibres dominate the load, with 100–500 mg fibre shed per kg of fabric, corresponding to 5,000–20,000 fibres/L in combined wash effluent — a concentration that overwhelms CAS and demands MBR minimum.
Cosmetics and personal care were the first sector regulated because microbeads are intentionally added, spherical, and easy to ban at the product level under EU REACH; however, legacy production in non-EU jurisdictions still discharges 10²–10³ particles/L. Tire wear is a special case: not a point-source discharge but up to 1.8 kg/km/year per vehicle, contributing the majority of urban runoff microplastic load — and now flagged for industrial pretreatment at vehicle and tire manufacturing sites, especially where plant stormwater co-mingles with process wastewater before discharge.
Self-assessment rule of thumb: if your plant sheds, washes, or extrudes polymer in any form, you are a sector hotspot; if you are a chemical formulator with polymer additives, you fall under the ECHA ≥1 t/yr reporting threshold.
A 4-Step 2026 Compliance Roadmap for Industrial Plants
- Step 1 — Baseline audit (Q3 2026). Pull 24-hour composite samples across three process streams — influent, post-biological, post-polish — and analyse each by FT-IR (≥20 µm) and Raman (≥10 µm). Report in both particles/L and fibres/m³ so your certificate survives a method change.
- Step 2 — Source control (Q4 2026). Install a rotary mechanical bar screen at 0.5–1 mm aperture on plastic-pellet and textile lines; expect a 30–50% load reduction at low CAPEX. Pair it with an automatic chemical dosing system for DAF coagulant optimisation if your process water is high-turbidity.
- Step 3 — Treatment upgrade decision (Q1 2027). If baseline exceeds 200 particles/L, retrofit MBR as the minimum. If it exceeds 50 particles/L, or your customer code requires the OECD 10 particles/L benchmark, add UF or ozonation polishing in the same capex window.
- Step 4 — Monitoring protocol (Q2 2027 onward). Run monthly FT-IR plus quarterly Raman with third-party verification, report in the EU UWWTD 2030 monitoring template even if your plant is below 100,000 PE — multinationals will require it, and retrofitting reporting formats later is more expensive than running them now.
Frequently Asked Questions
Is there a global microplastics discharge limit for industry? No. In 2026 the regulatory map is fragmented: the EU regulates product use under REACH, the U.S. leaves it to states, China has draft monitoring guidance, and ASEAN is following the EU template — no single number applies globally.
What is the EU limit for industrial microplastic discharge? There is no numerical industrial effluent limit in 2026. REACH Annex XVII restricts intentionally added microplastics (in force October 2023, derogations to 2029); UWWTD 2024/3019 mandates monitoring at plants ≥100,000 PE from 2030 with method pilots running through 2026.
How many microplastic particles per litre is acceptable in industrial effluent? No universal threshold exists. The Chinese draft GB/T guidance is 200 particles/L; the OECD/G20 2024 Osaka discussion benchmark is 10 particles/L; anything stricter than 10 particles/L currently requires UF or AOP polish to demonstrate.
Can MBR alone meet the strictest foreseeable microplastic limit? MBR alone delivers 90–95% removal and 10–30 particles/L effluent, sufficient for the 10 particles/L OECD benchmark at the upper end. Plants targeting 1–5 particles/L should plan UF polishing or ozonation-AOP in parallel.
What sampling method should an industrial plant use in 2026? FT-IR ≥20 µm plus Raman ≥10 µm, 24-hour composite sampling, monthly cadence — the combination that aligns with the EU UWWTD 2030 monitoring template and survives audits in any of the four jurisdictions.