Why Mombasa Industrial Effluent Compliance Is Non-Negotiable in 2026
Industrial wastewater treatment in Mombasa must meet Kenya's EMCA 2006 and Water Quality Regulations 2006 effluent limits, with NEMA licensing and an EIA study before construction. The standard train is screening + DAF + MBR + UV/RO polishing, designed for 28–32 °C feed and 2,000–8,000 mg/L TDS. A 50–500 m³/day system typically costs USD 140K–1.4M CAPEX and USD 0.45–1.10 per m³ OPEX.
Two instruments control every discharge in Kenya. The Environmental Management and Coordination Act (EMCA), Cap. 387 of 1999, sets the legal duty to obtain an effluent discharge license from NEMA before operating any plant that generates industrial wastewater. The Water Quality Regulations 2006 (Legal Notice No. 120) translate that duty into numeric effluent limits: BOD ≤ 30 mg/L, COD ≤ 50 mg/L, TSS ≤ 25 mg/L, oil & grease ≤ 10 mg/L, and pH 6.0–9.0 for discharge to the municipal sewer or to surface water (per Kenya Gazette, Legal Notice No. 120, 2006). A separate set of standards applies for irrigation reuse.
The licensing pathway itself runs 90–150 days once a complete file is lodged with NEMA. For any project above the throughput thresholds defined in the Environmental (Impact Assessment and Audit) Regulations 2003 (Legal Notice No. 101), a full EIA study by a NEMA-registered consultant is mandatory before the construction permit is issued. Bypassing the EIA is the most common reason Mombasa facilities receive closure orders: NEMA's enforcement powers under Section 108 of EMCA include spot fines up to KES 500,000 per offence, daily penalties of KES 20,000 for continuing violations, and license revocation that forces a 6–12 month re-application cycle. The reputational fallout — blacklisting from county water and from major buyers like Coca-Cola and Diageo supplier programs — usually costs more than the fine.
Typical Mombasa Influent Profile by Industry
Mombasa industrial wastewater runs 5–10 °C warmer than Nairobi feeds and carries 2–4× the dissolved solids, so an influent characterization built on inland Kenya numbers will undersize the biological stage. The table below benchmarks the four streams you will see most often in the coastal special economic zones.
| Industry | BOD (mg/L) | COD (mg/L) | TSS (mg/L) | FOG (mg/L) | pH | Temp (°C) |
|---|---|---|---|---|---|---|
| Food & beverage | 800–2,500 | 1,500–4,500 | 400–1,200 | 100–400 | 5.5–8.5 | 28–34 |
| Dairy processing | 1,000–3,000 | 2,000–5,500 | 300–900 | 200–800 | 5.0–9.5 | 28–36 |
| Brewery | 1,500–3,500 | 2,500–6,000 | 500–1,500 | 150–500 | 4.5–9.0 | 28–34 |
| Tannery / light mfg. | 700–2,000 | 1,500–4,000 | 1,000–3,000 | 50–250 | 6.0–10.0 | 26–32 |
Three coastal-feed specifics shape every design. First, feed temperature sits at 28–32 °C year-round, which pushes biological kinetics roughly 30% faster than the 20 °C basis most Nairobi plants are designed around, but it also halves oxygen solubility and can stall nitrification in the MBR. Second, TDS runs 2,000–8,000 mg/L — brackish levels driven by borehole intrusion and tidal influence on the Likoni aquifer — and chloride spikes above 1,500 mg/L are common after heavy rains. Third, dairy and brewery streams regularly exceed 200 mg/L FOG, and that fat has to come out before the bioreactor or you will get foam events and MLSS washout within 24–48 hours of a high-CIP discharge. Treat the effluent as a reusable resource rather than a waste stream — the iScience 2025 special issue on wastewater harvesting frames reuse, not disposal, as the design driver for coastal industrial systems.
The Standard Treatment Train for Mombasa: DAF → MBR → UV/RO
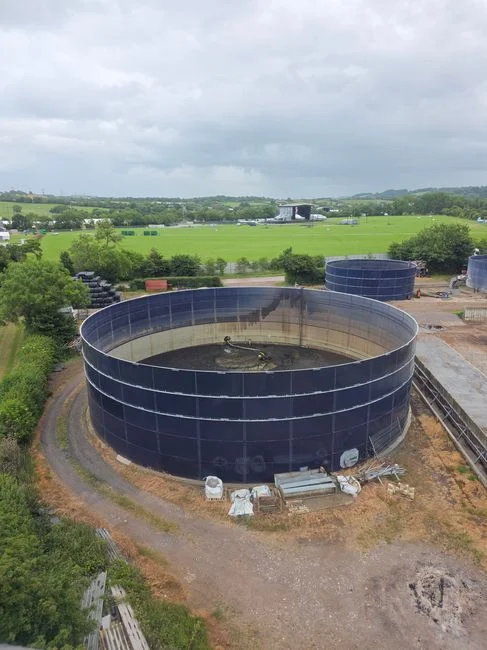
The 28–32 °C feed and high FOG push every Mombasa plant to the same four-stage train: coarse screening, dissolved air flotation, equalization, then an MBR with optional RO/UV polishing for reuse. Skipping any stage costs you either license compliance or membrane life.
| Unit | Function | Key design parameters | Typical removal |
|---|---|---|---|
| Rotary mechanical bar screen | Solids protection | 3–6 mm aperture, auto-cleaning | >50% large debris |
| Dissolved air flotation system | FOG + TSS + colloids | HRT 20–30 min, A/S 0.02–0.05, recycle 20–30% | TSS 90–95%, FOG 85–95% |
| Equalization tank | Flow & pH dampening | 6–8 h HRT, mechanical mixing, pH probe | pH stable 6–9 |
| MBR membrane bioreactor | BOD, COD, NH₃-N | Submerged PVDF, 0.1–0.4 μm pore, MLSS 8,000–12,000 mg/L | COD <50 mg/L, TSS <5 mg/L, NH₃-N <5 mg/L |
| Industrial RO system + UV | Polishing / reuse | Brackish RO 75% recovery, 254 nm UV at 40 mJ/cm² | TDS <500 mg/L, log 4 disinfection |
Step-by-step: the rotary mechanical bar screen removes rags, fruit solids, and CIP debris that would shred downstream pumps — set the aperture at 3 mm for brewery lines, 6 mm is acceptable for packaged-food lines with pre-grinding. The DAF stage then strips 85–95% of FOG at 20–30 min HRT, recovering float sludge at 3–5% DS; for dairy and brewery CIP streams, a coagulant dose of 50–150 mg/L polyaluminium chloride plus 2–5 mg/L anionic polymer is typical. A 6–8 hour equalization tank damps batch CIP surges and keeps the MBR feed inside its design envelope. The submerged PVDF MBR runs at MLSS 8,000–12,000 mg/L and delivers <50 mg/L COD and <5 mg/L NH₃-N in a footprint roughly 60% smaller than an equivalent conventional activated-sludge tank (per Springer 2025 review on MBR performance). For facilities targeting reuse — cooling tower make-up, boiler feed, or landscape irrigation — a brackish-water industrial RO system sized for 2,000–8,000 mg/L TDS feed achieves 75% recovery, and a 254 nm UV bank at 40 mJ/cm² provides log-4 disinfection before the treated water holding tank. Waste sludge from DAF float and MBR wasting is thickened in a lamella clarifier then dewatered on a plate-and-frame filter press to 22–28% DS cake for off-site disposal at the Kinanie licensed dumpsite.
Flow-Banded Equipment Selection Matrix
Sizing a coastal industrial plant by gut feel is the single biggest cause of OPEX overruns; the matrix below maps flow rate to the cheapest compliant configuration. Below 50 m³/day a packaged skid is almost always cheaper than a bespoke concrete tank; above 200 m³/day, concrete-and-steel becomes the lower-cost option despite longer civils.
| Size band | Configuration | Footprint (m²) | Power (kW) | Operator h/day | CAPEX (USD) |
|---|---|---|---|---|---|
| Small (10–50 m³/day) | WSZ underground packaged unit or MBR skid | 20–40 | 3–7 | 2 | 50K–140K |
| Medium (50–200 m³/day) | Containerized MBR + DAF skid | 60–150 | 12–25 | 4 | 200K–500K |
| Large (200–500 m³/day) | Concrete-tank MBR + RO reuse | 200–500 | 35–80 | 8 | 700K–1.4M |
Two practical ceilings govern the skid option. The WSZ series tops out at 80 m³/h peak hydraulic loading — anything above that needs the concrete tank, not a larger skid. The DAF is rated to 300 m³/h per unit; for flows above 200 m³/day you typically run two DAFs in parallel rather than oversize a single vessel. Power demand is dominated by the MBR permeate pump and the RO high-pressure pump: at 200 m³/day with RO polishing, expect 18–25 kW continuous draw, which translates to roughly 2.5–3.5 kWh per m³ of treated water at Mombasa's KES 22–25/kWh industrial tariff (Kenya Power, 2026-Q1 industrial schedule).
CAPEX and OPEX Breakdown for a 50–500 m³/day Plant
Finance will not approve a project without a defensible cost envelope. The bands below are drawn from coastal Kenya projects commissioned 2024–2025 and indexed forward to 2026 at 6–8% equipment inflation.
| Flow | CAPEX band (USD) | OPEX (USD/m³) | Payback |
|---|---|---|---|
| 50 m³/day | 140K–280K | 0.85–1.10 | 3.5–4.0 yr |
| 200 m³/day | 350K–700K | 0.55–0.80 | 3.0–3.5 yr |
| 500 m³/day | 900K–1.4M | 0.45–0.65 | 2.5–3.0 yr |
OPEX breaks down roughly as: energy 45–55% (aeration and RO high-pressure pump), chemical dosing 10–15% (coagulant, polymer, CIP chemicals, antiscalant), sludge handling 15–25% (filter press cloth replacement, transport to Kinanie, tipping fees), and labor 10–15% (typically 2–3 operators per shift on the larger plants). A 40–60% reuse rate offsets USD 0.30–0.70 per m³ of Mombasa County freshwater, and that credit alone returns CAPEX in 2.5–4 years on most food and dairy sites. NEMA license fees, EIA consultant fees, and the annual environmental audit add 3–6% to project CAPEX — budget them at the front end, not as a year-two surprise. For broader 2026 market context, the Industrial Wastewater Treatment Market Trends 2026: Tech, Compliance & Buyer Outlook brief covers equipment pricing trends across East Africa.
90-Day Implementation Timeline and NEMA Checklist
A compliant Mombasa plant is deliverable inside a single 13-week quarter if you sequence EIA scoping before equipment design. The block below is the schedule that has held on three coastal projects in 2024–2025.
- Weeks 1–3 — Scoping: site survey, composite influent sampling across two shifts, influent characterization report, EIA scoping report submitted to a NEMA-registered consultant.
- Weeks 4–8 — Design & fabrication: freeze P&ID and GA drawings, release equipment for fabrication at supplier works, complete civil foundation pour and bunding.
- Weeks 9–11 — Installation: equipment delivery to site, tank and skid placement, piping and electrical tie-ins, instrument calibration.
- Week 12 — Commissioning & sign-off: clean-water rinse, seed the MBR, ramp MLSS to design, operator training, 72-h performance test, NEMA inspection, effluent license issued.
One safety item that frequently gets dropped: chlorinate the treated water holding tank before reuse or discharge. A 0.5–1.0 mg/L free chlorine residual holds the tank against regrowth during the long storage windows common on coastal sites with intermittent demand. For facilities that prefer ClO₂ over chlorine — better biofilm control at high TDS — a chlorine dioxide generator dosed at 0.3–0.8 mg/L is the standard coastal practice. Pair it with an automatic chemical dosing system on the RO feed line to keep antiscalant and CIP dosing inside ±2% of setpoint despite the brackish feed swings.
Frequently Asked Questions
What is the cost of a 200 m³/day industrial wastewater treatment plant in Mombasa in 2026? USD 350K–700K CAPEX and USD 0.55–0.80 per m³ OPEX, with energy at 45–55% of OPEX and a 3.0–3.5 year payback against freshwater offsets at Mombasa County's 2026 tariff.
What are the Kenya NEMA effluent limits for industrial discharge in 2026? BOD ≤ 30 mg/L, COD ≤ 50 mg/L, TSS ≤ 25 mg/L, oil & grease ≤ 10 mg/L, pH 6.0–9.0, per the Water Quality Regulations 2006 (Legal Notice No. 120) read with EMCA Cap. 387.
How long does a NEMA effluent discharge license take in Kenya? 90–150 days from lodgement of a complete file, including a mandatory EIA study under Legal Notice No. 101 of 2003 for plants above the defined throughput thresholds.
Why is DAF preferred over a primary clarifier for dairy and brewery wastewater in Mombasa? DAF removes 85–95% of FOG and 90–95% of TSS at 20–30 min HRT, versus 50–60% TSS and minimal FOG removal in a gravity clarifier — and the FOG would otherwise foam and wash out the downstream MBR biomass.
Can RO treat Mombasa's brackish 2,000–8,000 mg/L TDS industrial feed? Yes — a brackish-water RO unit at 75% recovery brings TDS below 500 mg/L and pairs with a 254 nm UV stage at 40 mJ/cm² for log-4 disinfection before cooling-tower or boiler-feed reuse.