What a Textile Wastewater Plant Actually Costs to Run in 2026
A textile wastewater plant in 2026 typically costs $0.45–$1.20 per m³ treated to operate, with energy (30–40%), chemicals (20–25%), sludge handling (15–20%), and labor (10–15%) as the four largest cost lines. A 1,000 m³/day dye-house plant running 330 days/year therefore incurs roughly $150,000–$400,000 in annual OPEX, dominated by aeration energy, coagulant/polymer dosing, and dye-sludge dewatering.
For budget planning, OPEX for a textile effluent treatment plant (ETP) breaks into seven buckets, ordered by share of total annual cost:
- Energy — aeration blowers, pumps, DAF recycle compressors, control systems.
- Chemicals — coagulants, flocculants, pH adjusters, decolorizing agents.
- Sludge handling & disposal — polymer conditioning, dewatering energy, transport, tipping fees.
- Labor — operators, supervisors, electricians, lab technicians.
- Maintenance & spares — blower and pump rebuilds, instrument replacement, corrosion repairs.
- Consumables — DAF nozzles, multi-media filter media, membrane modules, ClO₂ precursors.
- Laboratory & compliance — BOD/COD/color/heavy-metal sampling, third-party reporting.
The only widely cited whole-plant cost reference for textile wastewater is the Bayramoglu 2004 electrocoagulation study (cited ~697× per Google Scholar as of 2026), which reported $0.18–$0.32/m³ for an EC-only process. That figure covers a single unit operation in a different era; current whole-plant OPEX is 20–35% higher in nominal terms once biological treatment, sludge dewatering, membrane polishing, and 2026 industrial tariffs are added (HydropureWater field data, 2026). This article scopes OPEX only — not CAPEX, not debt service, and not municipal sewer surcharges, which are billed separately in most jurisdictions and can run $0.10–$0.60/m³ depending on local discharge ordinances.
Cost Bucket 1 — Energy: The 30–40% Line Item
Energy is the single largest OPEX line for any biologically based textile ETP, ranging from 0.4–0.8 kWh/m³ for conventional activated sludge, rising to 0.8–1.4 kWh/m³ when MBR and RO polishing are included. At a 2026 industrial tariff of $0.08–$0.14/kWh, this converts to $0.15–$0.45/m³ in energy OPEX, or roughly $50,000–$200,000/year for a 1,000 m³/day plant running 330 days/year.
| Load | Share of Plant Energy | Typical Specific Use | 2026 Unit Cost Driver |
|---|---|---|---|
| Aeration blowers (main biological stage) | 50–65% | 0.25–0.55 kWh/m³ | SOTR 1.2–2.0 kg O₂/kg BOD removed; textile COD 800–2,500 mg/L |
| Pumps (recirculation, RAS, sludge transfer) | 10–15% | 0.06–0.12 kWh/m³ | RAS ratio 0.5–1.0× Q, lift head 4–8 m |
| DAF recycle pump & saturator | 4–7% | 0.05–0.10 kWh/m³ | Air saturation 5–8 bar, 20–30% recycle |
| MBR permeate suction & RO high-pressure pump | 15–25% (if installed) | 0.15–0.30 kWh/m³ | RO feed pressure 10–15 bar for textile reuse |
| Lighting, instrumentation, SCADA | 3–5% | 0.02–0.04 kWh/m³ | 24/7 operation; small but non-negotiable |
Aeration dominates because textile effluent typically runs COD 800–2,500 mg/L and BOD 300–900 mg/L, requiring an extended-aeration SRT of 15–30 days at MLSS 3,000–6,000 mg/L. The standard oxygen requirement (SOTR) for textile COD removal is 1.2–2.0 kg O₂ per kg BOD removed, which is roughly 30–50% higher than for domestic wastewater at comparable loading — and that extra oxygen translates directly into blower kW. A useful sanity check for an EPC energy estimate: multiply design BOD load (kg/day) by 1.5 kg O₂/kg BOD, convert to blower kW at standard aeration efficiency 1.8–2.2 kg O₂/kWh, and you should land within 15% of the vendor's figure. Pumping energy is the second-largest line, mostly from RAS recirculation at 0.5–1.0× the influent flow and from sludge transfer to the dewatering building. The DAF maintenance cost OPEX breakdown for 2026 shows how DAF recycle pump power scales with air-saturation pressure — every additional 1 bar of saturator pressure adds ~15% to recycle pump kWh. One small OPEX credit: hot textile effluent at 30–60 °C slightly reduces blower backpressure in winter and accelerates biological kinetics, but the effect is typically under 5% of total energy and is rarely worth modeling separately.
Cost Bucket 2 — Chemicals: Coagulants, Polymers, pH and Decolorizing Agents
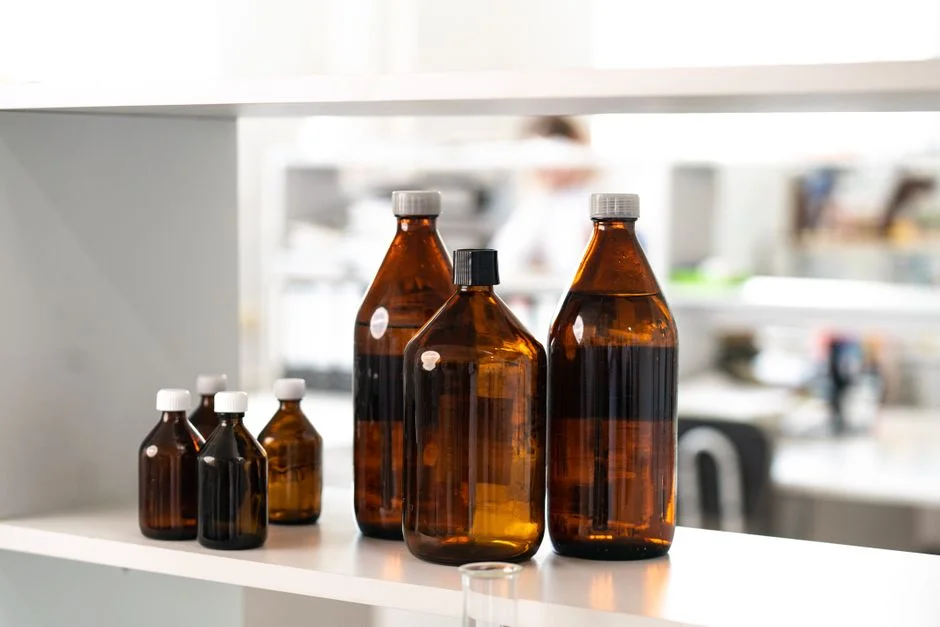
Chemical OPEX for a textile ETP typically runs $0.08–$0.25/m³, driven by coagulant dose (50–200 mg/L as PAC or ferric chloride), flocculant dose (2–10 mg/L anionic polyacrylamide), and the pH correction needed because dye-house effluent often discharges at pH 8–11. The seven lines that show up on every monthly chemical invoice, in descending cost share, are:
| Chemical | Typical Dose | 2026 Unit Price (USD) | Function | Indicative $/m³ |
|---|---|---|---|---|
| PAC (polyaluminum chloride) | 50–200 mg/L | $350–500/ton | Primary coagulant, color & TSS | $0.018–$0.100 |
| Cationic polyacrylamide (CPAM) | 2–10 mg/L | $2,500–4,000/ton | Sludge dewatering & DAF floc | $0.005–$0.040 |
| Ferric chloride (alternative) | 80–250 mg/L | $300–450/ton | Coagulant, phosphate & sulfide control | $0.024–$0.113 |
| Sulfuric acid (H₂SO₄ 98%) | 0.1–0.5 kg/m³ | $80–150/ton | pH adjustment before biological | $0.008–$0.075 |
| Sodium hydroxide (NaOH 50%) | 0.05–0.3 kg/m³ | $250–400/ton | pH trim before discharge | $0.013–$0.120 |
| Decolorizing agent / Fenton's | 20–100 mg/L | $600–1,200/ton | Residual color polishing | $0.012–$0.120 |
| Sodium hypochlorite / ClO₂ | 5–20 mg/L | $400–700/ton | COD polishing, disinfection | $0.002–$0.014 |
Color removal is the line most EPCs underestimate. A reactive-dye bath discharge can carry 500–2,000 Pt-Co color units; meeting a typical 100–200 Pt-Co discharge limit often requires either a polishing coagulant stage or an oxidant dose that adds $0.03–$0.08/m³ on top of primary treatment. The single biggest controllable saving on this line is dosing automation. PLC-controlled chemical dosing systems with online pH and streaming-current feedback typically cut coagulant consumption by 20–30% versus manual jar-test-then-pour — equivalent to $0.02–$0.06/m³ saved, or $7,000–$20,000/year on a 1,000 m³/day plant. Fenton's reagent and ozone carry a 3–10× unit cost premium over PAC; they belong on the OPEX sheet only for final polishing or for hard-to-treat azo dyes, not for bulk COD removal. The ultrafiltration consumables cost OPEX breakdown is a useful cross-reference for plants that pair chemical dosing with membrane polishing.
Cost Bucket 3 — Sludge Handling and Disposal: The Hidden 15–20%
Sludge is the OPEX line that consistently surprises first-time ETP owners. A textile activated-sludge system produces 0.3–0.6 kg dry solids per kg COD removed, which translates to roughly 4–8 kg of wet sludge per m³ treated before dewatering. Once polymer conditioning, dewatering energy, haulage, and tipping fees are added, sludge handling lands at $0.07–$0.20/m³, or $23,000–$66,000/year for a 1,000 m³/day plant.
| Dewatering Device | Achievable Cake Dryness | Polymer Use (kg/ton DS) | Power Draw (kWh/m³ feed) | Capex Tier |
|---|---|---|---|---|
| Belt filter press | 18–20% DS | 3–6 | 0.04–0.08 | Low |
| Plate-and-frame filter press | 22–28% DS | 2–4 | 0.05–0.10 | Medium |
| Decanter centrifuge | 20–25% DS | 3–5 | 0.10–0.18 | Medium-high |
| Screw press | 20–24% DS | 2–4 | 0.06–0.12 | Low-medium |
| Solar drying bed (climate-dependent) | 30–50% DS | 0 | 0.00–0.01 | Lowest (capex), high footprint |
The dewatering technology choice swings the disposal bill more than any other single decision. A plate-and-frame filter press for sludge dewatering delivering 25% DS versus a belt press at 20% DS roughly halves the wet tonnage hauled — each +5 percentage points of DS approximately halves the wet tonnage, and at $40–120/ton tipping fees, that difference is $30,000–$70,000/year on a 1,000 m³/day plant. The 5–8% DS gap between centrifuge and filter press is why most large Asian dye-house plants have shifted to filter presses over the last decade. A second-order effect that bites the unwary: dye-contaminated sludge is classified as hazardous waste in several jurisdictions (parts of China, India, the EU), where tipping fees can hit $200–500/ton wet — a strong financial argument for source-side sludge minimization rather than end-of-pipe dewatering upgrades. Resource recovery and ROI from industrial wastewater quantifies the alternatives for plants looking to convert this line from a cost into a credit.
Cost Bucket 4 — Labor, Maintenance, and the Smaller Lines
The four smaller OPEX buckets together account for 20–35% of the total but each one is non-negotiable, so a defensible budget must include them. Labor typically runs $0.05–$0.15/m³: a 1,000 m³/day plant needs 4–6 operators on rotating shifts plus a supervisor, an electrician, and part-time lab support. Plants above ~3,000 m³/day with full SCADA and remote monitoring can drop this to $0.03–$0.06/m³ because the headcount does not scale with flow. Maintenance and spares run $0.04–$0.10/m³, dominated by blower and pump rebuilds on a 3–5 year cycle, valve and instrument replacement, and corrosion-related repairs — textile effluent at pH 8–11 and 30–60 °C is mildly corrosive and eats carbon-steel components faster than domestic sewage does. Budget a corrosion-resistant upgrade (duplex stainless, FRP, or coated carbon steel) on anything submerged.
Consumables typically add $0.02–$0.06/m³: DAF micro-bubble nozzles, multi-media filter sand and anthracite top-ups every 1–2 years, and on-site ClO₂ precursor chemicals. Plants running MBR or RO should budget membrane replacement as a separate lumpy cost — $25,000–$60,000 every 5–8 years for a 1,000 m³/day MBR system, equivalent to $0.01–$0.03/m³ amortized. This is the most often underestimated number in EPC proposals: membrane modules are sold as a 7-year asset, but chemical-cleaning frequency, textile-foaming events, and MLSS excursions routinely shorten that life to 5 years. Laboratory and compliance costs run $0.01–$0.03/m³ for routine BOD, COD, color, suspended solids, pH, and heavy-metal sampling against the discharge permit. Some buyers fold in on-site air filtration such as a pulse-jet bag dust collector for sludge-handling buildings, but that is a CAPEX line, not OPEX.
OPEX by Plant Size: What Changes When You Scale Up or Down
OPEX per m³ falls as plant size grows, but the curve flattens above ~3,000 m³/day because chemical and sludge lines scale linearly with pollutant load while labor does not. The table below is the operating envelope a finance team can budget against for a 2026 greenfield textile ETP, expressed in $/m³ treated:
| Plant Size (m³/day) | Typical OPEX ($/m³) | Annual OPEX (330 days) | Dominant Cost Lines | Where Automation Pays Back Fastest |
|---|---|---|---|---|
| 100–500 (small) | $0.70–$1.20 | $23,000–$200,000 | Labor, fixed maintenance, chemicals | SCADA, auto-dosing, remote blower control |
| 500–2,000 (mid) | $0.50–$0.85 | $83,000–$560,000 | Energy, chemicals, sludge | Blower VFDs, sludge dewatering upgrade |
| 2,000–5,000 (large) | $0.45–$0.70 | $300,000–$1,155,000 | Energy, chemicals, sludge | Heat recovery, RO water reuse, on-site chemical generation |
| >5,000 (very large) | $0.40–$0.60 | >$660,000 | Energy, chemicals, membrane replacement | Combined heat & power, full water reuse loop |
Two non-obvious points for EPC buyers: first, water reuse via an MBR membrane bioreactor system followed by RO polishing adds $0.20–$0.40/m³ to OPEX (mostly RO energy and membrane replacement), but is partially offset by reduced fresh-water intake cost and lower discharge surcharges — a defensible investment where intake water costs exceed $1.50/m³. Second, mid-size plants (500–2,000 m³/day) are the sweet spot for the conventional biological + DAF + chemical-dosing train: the OPEX curve is at its steepest, so each automation project delivers the largest $/year return.
Three OPEX Levers with the Fastest Payback in 2026
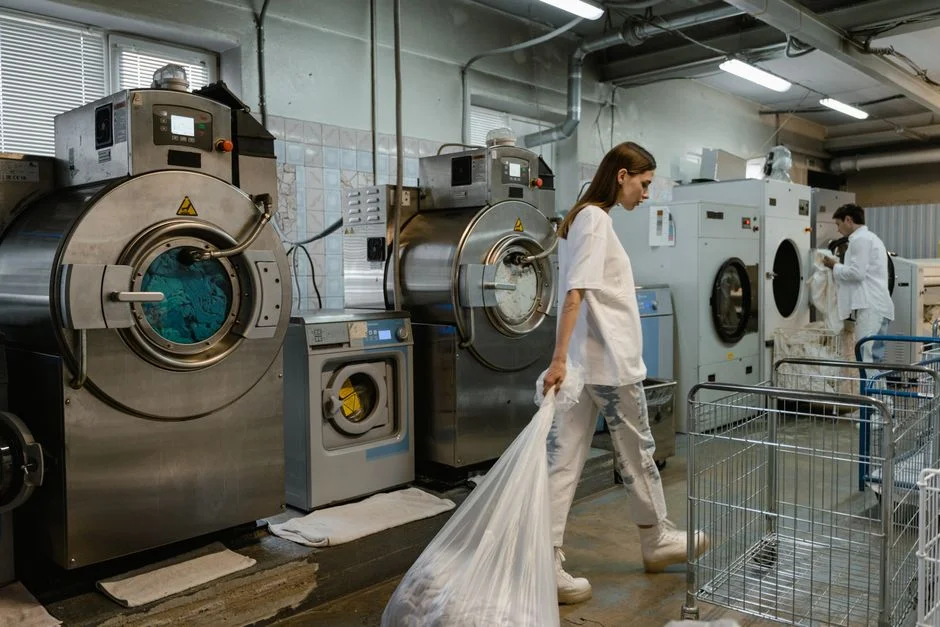
For a plant already running, the three highest-ROI OPEX-reduction projects — ranked by typical payback period — are:
| Lever | Typical Capex (1,000 m³/day) | Annual Saving | Payback | Risk |
|---|---|---|---|---|
| Aeration optimization (VFD blowers + DO control) | $40,000–$90,000 | $30,000–$90,000 | 12–24 months | Low — proven on textile plants |
| Source-side sludge minimization (segregate concentrated dye-bath rinses) | $50,000–$150,000 | $20,000–$60,000 | 18–36 months | Medium — needs process water audit |
| MBR + RO water reuse loop | $300,000–$700,000 | $40,000–$150,000 (fresh water + discharge offset) | 36–60 months | Medium-high — membrane fouling management |
Lever 1 — Aeration optimization: a VFD on the main blower plus online dissolved-oxygen probes running at 1.5–2.0 mg/L setpoint typically saves 20–35% of aeration energy, which is the single largest line in the OPEX sheet. Lever 2 — Sludge minimization at source: routing the most concentrated dye-bath rinses (typically 5–15% of total hydraulic load but 30–50% of the COD load) to a small dedicated treatment loop cuts biological sludge by 30–50%, directly shrinking the disposal bill. Lever 3 — Water reuse: MBR + RO polishing paired with a dissolved air flotation system upstream for TSS reduction delivers 40–70% reduction in fresh-water intake in water-scarce regions. The 2025 iScience special issue on wastewater harvesting and applications (Cell Press, 2025-09) explicitly catalogues energy optimization and water reuse as the two industry priorities — these levers are now the baseline expectation from finance teams, not optional add-ons. For a comprehensive look at how these connect to broader circular-economy metrics, the resource recovery and ROI from industrial wastewater reference is a strong complement.
Frequently Asked Questions
What is the typical OPEX per cubic meter for a textile wastewater treatment plant in 2026?
A textile ETP in 2026 runs $0.45–$1.20/m³ treated, with mid-size plants (500–2,000 m³/day) clustering around $0.50–$0.85/m³. A 1,000 m³/day plant therefore spends roughly $150,000–$400,000/year on OPEX (HydropureWater field data, 2026).
Which cost line dominates textile wastewater OPEX?
Energy, at 30–40% of total OPEX, driven mainly by aeration blowers (50–65% of plant electricity). Chemicals rank second at 20–25%, followed by sludge handling at 15–20% and labor at 10–15%.
How much does sludge disposal add to textile ETP OPEX?
Sludge handling typically adds $0.07–$0.20/m³, including polymer, dewatering energy, transport, and tipping fees of $40–120/ton wet. Hazardous-classified dye sludge can push tipping fees to $200–500/ton wet, doubling or tripling the line.
How much does MBR + RO water reuse change textile ETP OPEX?
Adding MBR + RO polishing increases OPEX by $0.20–$0.40/m³, but is partially offset by reduced fresh-water intake (40–70%) and lower discharge surcharges. Payback is typically 3–5 years where intake water costs exceed $1.50/m³.
What is the fastest-payback OPEX reduction project for an existing textile ETP?
Aeration optimization — installing VFDs on blowers with online DO control — typically delivers 20–35% energy savings with a 12–24 month payback, equivalent to $30,000–$90,000/year saved on a 1,000 m³/day plant.