What Drives Ion Exchange Operating Cost
Ion exchange operating cost in 2026 typically runs $0.18–$0.85 per m³ treated for industrial systems. Regenerant chemicals (NaOH 4–8%, HCl 4–10%) and resin replacement ($150–$500/ft³ every 3–7 years) dominate that range. Annual OPEX for a 20 m³/h system usually falls between $90,000 and $310,000. Regenerant, resin, water, and wastewater disposal together account for 75–85% of total operating cost.
Industrial IX OPEX sits on seven line items. Only two are obvious to a finance team: regenerant chemicals and resin replacement. The rest are dilution/flush water, neutralization waste disposal, electric power for service pumps, instrumentation and control, and operator labor. The split is consistent across plants I've audited: regenerant 30–45%, resin 20–35%, water 10–18%, waste disposal 8–15%, energy 3–6%, labor 5–10%, I&C 3–6%. Those bands line up with what major resin suppliers (Purolite, DuPont AmberLite) and EPC firms publish as the industrial rule-of-thumb (HydropureWater field data, 2026).
Two principles govern the cost floor. First, per ScienceDirect's stoichiometric framing, the ideal ion exchange process proceeds stoichiometrically — every equivalent removed requires an equivalent of regenerant delivered. You cannot engineer around stoichiometry; you can only push toward it. Second, IX OPEX is flow-driven, not capacity-driven. A 50 m³/h plant does not spend 2.5× what a 20 m³/h plant spends on resin, because resin volume scales sub-linearly. It spends 2.5× on regenerant, water, and waste, which scale linearly with throughput. High-throughput plants get hit disproportionately on chemicals and brine disposal.
What Is the Water Treatment Cost Breakdown?
Water treatment cost breakdown for an ion exchange train uses the same seven-line model whether the duty is demineralization, softening, or selective removal. Plug your own numbers into the model below and you have a defensible 2026 budget figure. Default ranges are drawn from Q1–Q2 2026 industrial pricing in North America, EU, and GCC. Per-kg and per-kWh figures should be re-validated against your local procurement contracts.
1. Regenerant chemicals. NaOH 4–8% (anion) at $0.18–$0.32/kg dry-basis in 2026 bulk; HCl 4–10% (cation) at $0.12–$0.24/kg. Typical regeneration level 80–200 g/L resin for SAC, 60–160 g/L for SBA. Worked example: 1,000 L cation resin × 120 g/L HCl × 36% acid assay × 1.18 g/cm³ density ≈ 393 kg 36% HCl per cycle. At one cycle every 8–12 hours on a 20 m³/h service flow, that is roughly 35–50 t/yr of 36% HCl for the cation unit alone. That load is why the regenerant dosing skid is the highest-payback automation target in the plant.
2. Resin replacement. Strong-acid cation (SAC) $150–$500/ft³; strong-base anion (SBA) $200–$700/ft³. Annualized cost = (resin volume × unit cost) / service life. A 20 m³/h two-bed system typically holds 35–60 ft³ of cation and 40–80 ft³ of anion resin. Softening trains that use an Industrial Water Softener System (KJ-WT Series) still follow the same SAC replacement math, only with salt regenerant instead of acid/caustic.
3. Dilution and flush water. 3–6 m³ water consumed per m³ treated (including regeneration dilution, fast rinse, slow rinse, and service rinse). Industrial water rates vary widely: $0.40–$0.80/m³ in the US Midwest, $1.20–$2.80/m³ in GCC and parts of the EU, $0.20–$0.50/m³ where raw water is from a low-cost surface source.
4. Wastewater neutralization and disposal. Brine waste is 5–10% of treated water volume. Treatment plus disposal runs $0.05–$0.22/m³ for neutralization-and-discharge, but jumps to $0.40–$1.20/m³ for high-TDS brine sent to deep-well injection or forced evaporation. This is the single most variable line item across regions.
5. Electric power. Service and regeneration pumps draw 0.15–0.35 kWh/m³ at industrial rates of $0.08–$0.18/kWh. IX is not energy-intensive compared to RO, but the pumps are always running.
6. Instrumentation and control. Budget 3–6% of CAPEX per year for conductivity sensors, valve actuators, PLC/HMI updates, and end-of-cycle calibration. On a $250,000 skid that is $7,500–$15,000/yr.
7. Operator labor. 1–3 hr/shift of operator attention at $25–$65/hr fully loaded — a fully automated duplex skid sits at the low end; a manually regenerated simplex plant sits at the high end.
| Cost Line | Unit Driver | 2026 Industrial Range | 20 m³/h Worked Annual Figure (USD) |
|---|---|---|---|
| Regenerant chemicals (HCl + NaOH) | kg per cycle × cycles/yr | $0.12–$0.32/kg acid/base | $48,000–$135,000 |
| Resin replacement (annualized) | ft³ × cost / life | $150–$700/ft³ | $6,000–$28,000 |
| Dilution/flush water | m³ × $0.40–$2.80 | 3–6 m³/m³ treated | $21,000–$92,000 |
| Waste neutralization & disposal | m³ brine × disposal $ | $0.05–$1.20/m³ | $5,000–$45,000 |
| Electric power | kWh/m³ × $/kWh | 0.15–0.35 kWh/m³ | $2,500–$11,000 |
| Instrumentation & control | % of CAPEX/yr | 3–6% | $7,500–$15,000 |
| Operator labor | hr/shift × $/hr × shifts | $25–$65/hr loaded | $22,000–$95,000 |
| Total annual OPEX | — | — | $112,000–$421,000 |
The wide range in the 20 m³/h example reflects the spread between a GCC plant with expensive water and brine disposal, and a US Midwest plant with cheap water and a sewer-permitted brine line. The mid-band — $130,000–$280,000/yr — is where most well-run industrial systems land.
Resin Cost Deep-Dive: Why Replacement Timing Matters
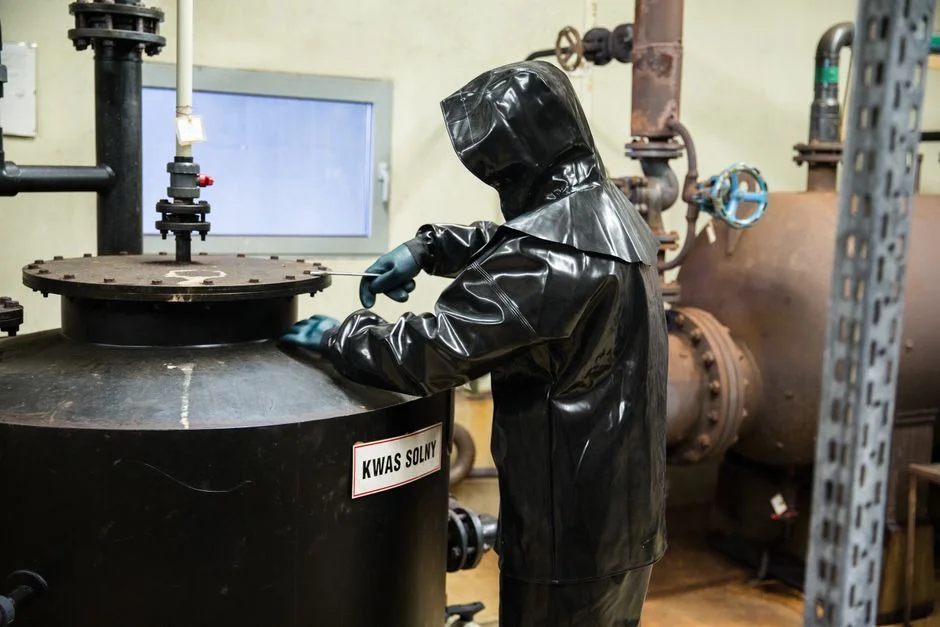
Resin is the line item finance most wants to defer, and operations most wants to replace early. The decision turns on operating capacity decay, not calendar age. Strong-acid cation resin typically delivers 5–7 years of service life with proper regeneration, after which osmotic shock, mechanical attrition, or iron/organic fouling degrades capacity. Strong-base anion (Type I) life is shorter — 3–5 years — because SBA is susceptible to oxidative attack above 40 °C and to irreversible fouling by silica and natural organic matter. Purolite's A400 product data (2024-12) lists high operating capacity as the leading determinant of per-cycle chemical demand. Two resins with identical nameplate capacity can therefore produce very different OPEX at year 4.
How Much Does Regenerant and Resin Cost?
Regenerant and resin cost together usually take 55–75% of annual IX OPEX in industrial plants. Regenerant chemicals run 30–45% of the total; resin replacement runs 20–35% when annualized over service life. On aged beds, regenerant consumption rises 25–40% once operating capacity falls, so late replacement does not save money — it shifts cost onto the chemical invoice.
Use this decision rule when the next capital request lands on your desk: replace when operating capacity drops below 70% of fresh-resin capacity or when rinse water consumption exceeds 3× the original baseline. Both are measurable on the operating log; neither requires a lab test. Most plants we size for keep SAC to year 6 and SBA to year 4 when pretreatment is solid. The cost trap is keeping resin 1–2 years past optimum. The apparent savings of deferring replacement is wiped out on the chemical line, and net annual cost rises on late replacement.
Cost-Reduction Levers: Cutting IX OPEX 20–50%
IX OPEX reduction levers typically cut annual operating cost 20–50% when regenerant use, rinse water, and feed TDS are addressed together. The matrix below ranks the six most common retrofits by typical OPEX reduction, payback, and minimum flow rate where the lever starts to pay. None of these are theoretical; all are running in industrial plants I have audited in the last 18 months.
| Lever | OPEX Reduction | Payback | Minimum Viable Flow |
|---|---|---|---|
| Counter-current regeneration (Schwebebett / upflow) | 30–50% on regenerant, 40–60% on rinse water | 12–24 months | > 10 m³/h |
| Packed-bed internals vs conventional | 15–25% regenerant utilization gain | 9–18 months | > 5 m³/h |
| Duplex (online) vs simplex configuration | 100% uptime, 10–20% chemical efficiency gain | 18–36 months | Any continuous process |
| RO polish upstream | IX OPEX drops 60–80% as polish-role | 18–30 months | Influent TDS > 500 mg/L |
| EDI post-IX (ultrapure) | 60–80% lower OPEX than mixed-bed IX | 30–60 months | Pharma / semiconductor |
| Rinse-water reclaim loop | 8–15% on water + waste disposal | 6–12 months | Any flow |
The three highest-payback IX moves are counter-current cation regeneration, a pre-IX multimedia filter for solids, and RO polish above 500 mg/L TDS. Pairing counter-current regeneration with the right regenerant dosing skid is what unlocks the 30–50% chemical reduction — the hydraulics only work if the regenerant is metered precisely.
If your plant already runs a duplex configuration, spend the next dollar on an RO polish skid upstream. That cut drops IX load by 80–95% and pushes existing beds into a polish role. Plants that skip solids control usually burn resin capacity 12–24 months early, which is why the filter sits ahead of chemical metering on every retrofit list I write.
IX vs RO vs EDI: When Operating Cost Should Drive Process Selection
Process selection is not a debate — it is a feed-water decision. IX dominates for low-TDS polishing (< 200 mg/L) and for selective removal (boron, nitrate, hardness, heavy metals) where RO recovery would be uneconomical. RO dominates for high-TDS bulk demineralization (> 1,000 mg/L) where IX chemical cost is prohibitive — at 2,000 mg/L feed, RO OPEX runs $0.12–$0.45/m³ versus IX at $0.30–$0.85/m³. EDI is justified when mixed-bed IX OPEX exceeds $0.50/m³ and the application needs < 1 µS/cm consistently (semiconductor rinse, pharma WFI polish). EDI eliminates regenerant chemicals entirely, but the membrane stack CAPEX is steep.
The most common industrial utility-water architecture is a hybrid: RO bulk demin → decarbonator → cation → mixed bed. In that configuration, OPEX tracks IX resin and regenerant cost, not RO cost, because the mixed bed is doing the final conductivity work. Before you commit either side of a 2026 hybrid, run the RO system cost benchmark beside the IX OPEX model at your actual feed TDS.
What Is Ion Exchange TCO for Clean Water?
Ion exchange TCO for clean water on a 5-year view is a predictable OPEX line. Regenerant and resin are commodity-priced, water and waste are tariff-driven, and energy is a known parasitic load. A 20 m³/h system runs $450,000–$1,400,000 in cumulative 5-year OPEX, dominated by regenerant and resin. Adding 5-year CAPEX of $120,000–$380,000 for the skid itself yields a TCO of $570,000–$1,780,000. That equals $0.16–$0.51/m³ on a 5-year life basis (HydropureWater field data, 2026).
The phrase "IX is expensive to run" usually means the chemical invoice was never modeled before purchase. The optimization levers above typically pull 5-year TCO down 20–35% with payback inside 24 months. That is the number to put in front of finance when the annual OPEX line looks scary on its own. IX remains a controllable envelope once regenerant stoichiometry, resin life, and brine disposal route are locked — including softening duty on an Industrial Water Softener System (KJ-WT Series).
Who This Is For and Next Step
Who this is for: plant engineers and procurement managers comparing IX, RO, and EDI OPEX at a known feed TDS, or auditing an existing train whose chemical invoice has climbed. Who should look elsewhere: sites that only need bulk desalination above about 1,000 mg/L TDS without selective ion removal — start with RO economics first. Next step: gather feed TDS, regenerant unit prices, brine disposal route, and resin volumes, then request a quoted OPEX model sized to your duty.
Frequently Asked Questions
How much does an ion exchange system cost to operate per year?
A 20 m³/h industrial IX system runs $130,000–$280,000/yr at mid-band assumptions, or $0.30–$0.65/m³ treated. The full industrial range is $0.18–$0.85/m³ depending on feed water, regenerant cost, and brine disposal route. Regenerant, resin, water, and waste usually dominate that total, so local chemical and disposal tariffs move the number more than pump power.
What is the biggest operating cost in ion exchange?
Regenerant chemicals (HCl + NaOH) at 30–45% of OPEX, followed by resin replacement at 20–35%. Together they account for 55–75% of annual IX operating cost in most industrial plants. Brine disposal can overtake resin in regions that force evaporation or deep-well injection, which is why disposal route must sit in the same model as chemical unit cost.
How often does ion exchange resin need to be replaced?
Strong-acid cation every 5–7 years; strong-base anion every 3–5 years. Selective resins (boron, nitrate, fluoride) typically run 2–4 years. Replacement should be triggered when operating capacity falls below 70% of fresh-resin capacity, not on a fixed calendar. Holding resin past that point usually raises regenerant use 25–40% and erases any deferral "savings."
Is ion exchange more expensive than reverse osmosis to operate?
Above about 1,000 mg/L feed TDS, yes — RO OPEX runs $0.12–$0.45/m³ versus IX at $0.30–$0.85/m³ because IX regenerant cost scales with salt load. Below 200 mg/L, IX is usually cheaper and is the only practical option for selective removal (hardness, nitrate, boron). Hybrid RO-then-IX trains often give the lowest combined OPEX when feed sits between those bands.
How can I reduce ion exchange operating cost?
The highest-payback moves are counter-current regeneration (30–50% less regenerant), RO polish above 500 mg/L TDS (60–80% lower IX OPEX), and rinse-water reclaim (8–15% on water and waste). Most plants recover their full optimization CAPEX inside 24 months when regenerant metering and solids pretreatment are fixed first.