Which Indian Regulation Sets Your Total Phosphorus Limit in 2026
India's total phosphorus (TP) discharge limit in 2026 sits inside a four-tier hierarchy: the Ministry of Environment, Forest and Climate Change (MoEFCC) sets policy; the Central Pollution Control Board (CPCB) issues national standards through Schedules I–VII under the Water (Prevention and Control of Pollution) Act, 1974 and the Environment (Protection) Act, 1986; State Pollution Control Boards (SPCBs) impose consent conditions that may be stricter; and the individual plant carries that limit into its Consent to Establish (CTE) and Consent to Operate (CTO). The CPCB General Standards for Discharge of Effluents (Schedule II, originally notified 1986, last substantively amended 2017) sets TP at 5 mg/L (as P) maximum for Inland Surface Water discharges — the statutory floor before any industry-specific override kicks in. CPCB's Industry-Specific Standards (Schedule VI) tighten this floor to 0.5–3.0 mg/L (as P) depending on the sector. SPCBs such as MPCB, GPCB, TNPCB, KSPCB and WBPCB routinely override CPCB further — TNPCB's dairy consent of 1.0 mg/L and NMCG's 0.5 mg/L for Ganga-basin industries are common working numbers. CPCB's draft 2024 re-categorization of industrial sectors continues to tighten TP for fertilizer, dairy, and distillery, and those revised values are showing up in 2025–2026 consent renewals across Maharashtra, Gujarat, and Uttar Pradesh. For broader BOD context alongside TP, see the BOD discharge limit for Indian industry reference.
CPCB Schedule VI Industry-Specific TP Limits (2026 Snapshot)
The table below consolidates Schedule VI and Schedule II values that show up in actual 2025–2026 CTO renewals across the fertilizer, dairy, sugar, distillery, pulp & paper, tannery, refinery, and textile sectors. Every value is the final discharge point limit, applied after the ETP or STP — not at the upstream biological reactor, and not at the clarifier overflow. Two conversion points matter here: the older Schedule VI notifications list "Phosphate (as PO4)" rather than "Phosphorus (as P)" — divide PO4 values by 3.066 to get P, which is the unit your consent will use. For P2O5, divide by 2.291. The fertilizer (nitrogenous) limit of 0.5 mg/L is the tightest statutory number in the Indian framework and is the design benchmark for any ETP discharging upstream of a sensitive water body.
| Industry Sector | CPCB Standard Source | TP Limit (mg/L as P) | Notification / Reference |
|---|---|---|---|
| Fertilizer (urea / NPK / nitrogenous) | Schedule VI | 0.5 | Fertilizer Industry (Nitrogenous) notification, reaffirmed 2023 |
| Pulp & paper (large mills, > 24,000 MT/yr) | Schedule VI | 1.0 | Pulp & Paper Industries notification, amended 2019 |
| Sugar (integrated, > 2,500 TCD) | Schedule VI | 1.0 | Sugar Industry notification, 2009 (in force 2026) |
| Distillery (molasses-based, spent wash) | Schedule VI | 1.0 | Distillery Industry notification, amended 2020 |
| Dairy (processing > 100 kLPD) | Schedule VI | 1.0 | Dairy Industry notification, 2019 (reaffirmed 2024) |
| Tannery (chrome tanning) | Schedule VI | 2.0–3.0 | Tannery Industry notification, amended 2019 |
| Petrochemical (integrated) | Schedule VI | 2.0 | Petrochemical Industry notification, 2010 |
| Oil refinery (stand-alone) | Schedule VI | 1.0–2.0 | Oil Refinery Industry notification, amended 2019 |
| Pharmaceutical (formulation) | Schedule VI | 1.0 | Pharma Formulation Industry notification, 2018 |
| Textile (wet processing) | Schedule VI | 2.0 | Textile Industry notification, amended 2019 |
| Iron & steel (integrated, cooling tower bleed) | Schedule VI | 0.5 | Iron & Steel Industry notification, amended 2019 |
| Common STP / CETP (real estate, township) | Schedule II fallback | 2.0 (typical consent value) | CPCB CETP guidelines, 2017 |
| All other industries not specified | Schedule II, Part A | 5.0 | General Standards, Inland Surface Water |
For coastal or marine discharges under Schedule II Part B, TP is not separately specified, and the Inland Surface Water 5 mg/L value typically carries over as a consent condition — but most coastal SPCBs (Gujarat, Tamil Nadu) have begun writing 1.0–2.0 mg/L into coastal CTOs regardless of the schedule silence.
State PCB Variations: MPCB, GPCB, TNPCB and Other Tightened Consents
CPCB is the ceiling, not the floor. Your actual consent number comes from the SPCB. The table below reflects the TP values that MPCB, GPCB, TNPCB, KSPCB, and WBPCB are writing into 2024–2026 CTO renewals, drawn from publicly available consent orders and SPCB circulars. NMCG's 0.5 mg/L floor for the Ganga main stem and tributaries is a separate statutory track under the Namami Gange programme, not an SPCB consent condition, but it functionally overrides CPCB wherever a plant's drain maps to a Ganga sub-basin.
| State PCB / Authority | Typical Consent TP (mg/L as P) | Applies To | Governing Order / Note |
|---|---|---|---|
| MPCB (Maharashtra) | 2.0 inland; 0.5 lake outlets | Industrial CETPs, STPs | MPCB CTO format, lakes (Powai, Vihar, Pashan) |
| GPCB (Gujarat) | 1.0–2.0 | Vapi, Vatva, Naroda, Narmada canal estates | GPCB common-Effluent consent template, 2023 |
| TNPCB (Tamil Nadu) | 1.0–2.0 | Dairy, sugar, food processing, coastal distilleries | TNPCB CTO renewals, seasonal monsoon variation |
| KSPCB (Karnataka) | 1.0–2.0 inland; 0.5 wetlands | Inland discharges, drains into Ranganathittu, Magadi | KSPCB wetland protection circular, 2022 |
| KSPCB (Kerala) | 1.0–2.0; 0.5 Ramsar | Vembanad, Ashtamudi catchment discharges | KSPCB Ramsar buffer circular, 2023 |
| WBPCB (West Bengal) | 1.0 standard, tightening to 0.5 | Municipal STPs on the Hooghly | WBPCB post-2023 CTO renewals |
| NMCG (Ganga basin) | 0.5 | All drains into Ganga main stem/tributaries | NMCG Ganga River Basin Management Plan, 2022 update |
State PCBs also define the sample point. MPCB and GPCB both require the TP grab to be taken at the final discharge monitoring port, after the STP/MBR outlet, not at the secondary clarifier weir. A 2024 MPCB audit of 23 STPs in the Pune region found that 17 of them were sampling upstream of the final polishing step, which is why their reported numbers were 30–60% lower than the actual discharge value (MPCB audit summary, 2024).
Total Phosphorus vs Phosphate: What the Lab Must Measure and Report
TP (as P) is the regulated parameter in every Indian consent order — not ortho-phosphate, not total phosphate, not P2O5. TP is the sum of orthophosphate (PO4³⁻), polyphosphate (P2O7⁴⁻, P3O10⁵⁻), and organically bound phosphorus after an acid-persulfate digestion step that hydrolyses everything to ortho-P. Reporting only ortho-P will under-report TP by 20–60% because most Indian industrial effluents carry 30–70% of their phosphorus as polyphosphate or organically bound P — ferric and alum dosing in upstream coagulation converts ortho-P to particulate P, which the lab then has to digest back into solution. APHA Standard Methods 4500-P defines the analytical path: Method B (Ascorbic Acid) covers 0.01–0.5 mg/L P with a 1-cm cell, and Method C (Vanadomolybdophosphoric Acid) covers 0.1–10 mg/L P — most NABL-accredited Indian environmental labs run Method B for compliance TP, switching to Method C only for high-strength samples. Sample handling is the audit-failure point: preserve with H2SO4 to pH < 2, store at 4°C, and analyse within 28 days; a field grab without preservation is not valid for consent reporting. For online monitoring on the final discharge line, see the online phosphate analyzer cost and selection reference.
| From | To Phosphorus (as P) | To Phosphate (as PO4³⁻) |
|---|---|---|
| 1 mg/L PO4³⁻ | 0.3261 mg/L P | — |
| 1 mg/L P2O5 | 0.4364 mg/L P | 1.3381 mg/L PO4³⁻ |
| 1 mg/L H3PO4 | 0.3161 mg/L P | 0.9694 mg/L PO4³⁻ |
| 1 mg/L P (elemental) | — | 3.0662 mg/L PO4³⁻ |
Conversion errors cost plants consent renewals. A 3.0 mg/L PO4³⁻ limit reads 0.98 mg/L P, not 3.0 mg/L P — a 3× mistake in either direction. The PO4-to-P conversion factor of 0.3261 comes from atomic weights (P = 30.97, PO4 = 94.97), and it's the same factor your NABL lab's LIMS will apply when it reports TP (as P). If your internal report still shows PO4, demand a re-issue — auditors will not.
Treatment Technologies to Hit Indian TP Limits
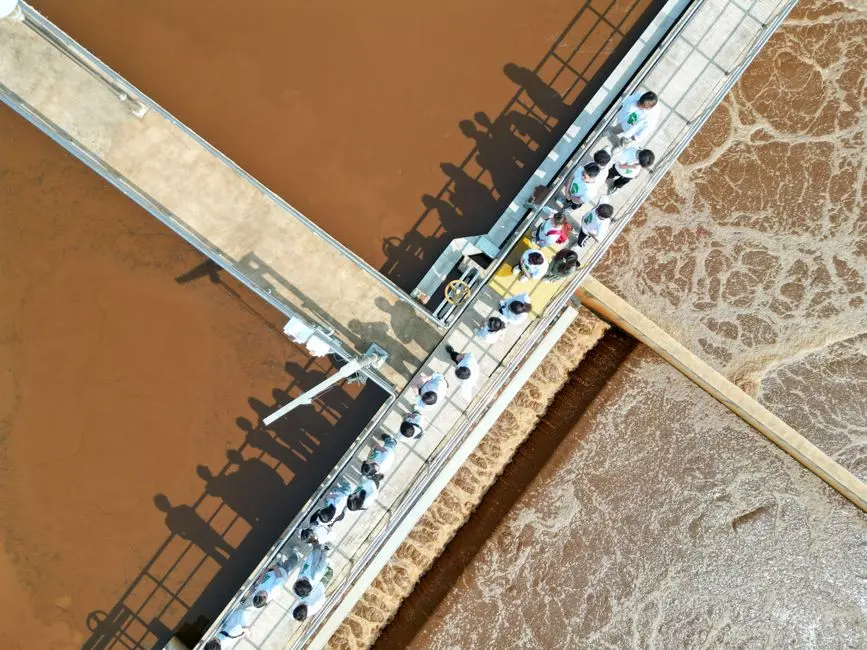
The TP limit tier dictates the treatment train. Single-stage chemical precipitation with alum or PAC at 50–150 mg/L and pH 6.5–7.5, followed by a DAF system for chemical phosphorus precipitation, reliably delivers 3.0–5.0 mg/L P from a raw effluent starting at 8–15 mg/L P — enough to meet the CPCB Schedule II floor but not most Schedule VI sector limits. For 1.0–2.0 mg/L, which is the working consent range for sugar, dairy, distillery, pulp & paper, and most MPCB/GPCB inland discharges, the train is enhanced biological phosphorus removal (A2O or A/O with an anaerobic zone) plus chemical polishing; biological excess P uptake alone rarely sustains < 2 mg/L without coagulant backup, and a coagulant backup needs an automated coagulant dosing for TP removal loop tied to the influent flow. For ≤ 0.5 mg/L — NMCG, lake-outlet consents, fertilizer nitrogenous — the train becomes tertiary chemical precipitation with FeCl3 or PACl at 80–200 mg/L, an MBR system for tertiary phosphorus polishing with PVDF membranes at 0.1–0.4 μm pore size, and a sand/anthracite dual-media filter downstream; dual-stage FeCl3 precipitation recovers > 95% P and stabilises the MBR flux. The chemical sludge from these trains is typically 2–4% dry solids and needs a plate-and-frame press for chemical phosphorus sludge to bring it to 25–30% DS for off-site disposal or struvite recovery — P content of the dried cake runs 1–3% by mass. For the upstream side of the train, see the domestic sewage phosphorus removal process engineering guide, and for downstream OPEX on cake handling, the sludge thickening and dewatering cost optimization reference.
Frequently Asked Questions
What is the TP limit for the Indian fertilizer industry in 2026? CPCB Schedule VI sets TP at 0.5 mg/L (as P) for the fertilizer (nitrogenous/urea/NPK) sector — the tightest statutory TP limit in the Indian framework, applied at the final ETP discharge. State PCBs do not relax this; MPCB and GPCB have written 0.5 mg/L into 2024–2026 fertilizer CTOs without exception.
What TP limit applies to CETP discharge in India? CETP consents typically set TP at 1.0–2.0 mg/L (as P) for inland discharges, tightened to 0.5 mg/L for outlets into protected lakes or the Ganga basin under NMCG; MPCB's CETP consent template uses 2.0 mg/L as the default and 0.5 mg/L for lake-adjacent estates.
Is ortho-phosphate the same as total phosphorus for consent reporting? No. TP (as P) is the regulated parameter and includes ortho-P, polyphosphate, and organically bound P after acid-persulfate digestion per APHA 4500-P; reporting only ortho-P will under-report TP by 20–60% and fail an audit verification even if the self-test passes.
What TP level triggers consent revocation under the Water Act 1974? Continuous exceedance of the consent TP limit for more than 15 days, or a single exceedance by > 3× the limit, can trigger Section 33A revocation proceedings; MPCB's 2024 enforcement notices show TP > 5 mg/L against a 2 mg/L consent is the most common trigger.
What is the NMCG TP requirement for Ganga-basin industries? NMCG enforces TP ≤ 0.5 mg/L (as P) for any industry discharging into the Ganga main stem or its notified tributaries, under the Ganga River Basin Management Plan (2022 update); this overrides CPCB Schedule VI for all Ganga-basin plants, regardless of sector.