What Changes When Plastics Wastewater Moves from CAS to MBR
For plastics and rubber wastewater in Cambridge, MBR is usually the stronger option when the stream is high-strength, variable, difficult to clarify, or needed for reuse; conventional activated sludge can remain cost-effective when biodegradability and sludge settling are reliable and space is available. A 2024 rubber-effluent study reported more than 98% COD removal, reducing COD from 22,158 ± 2,859 mg/L to 118 mg/L, but this is not a guarantee for every plant. MBR adds membrane fouling, cleaning, aeration, and replacement duties, while CAS adds clarifier and sludge-handling requirements. The decision should follow source-specific wastewater analysis, the permitted discharge or reuse target, pilot evidence, and a life-cycle cost comparison.
Conventional activated sludge combines biological treatment with gravity clarification and return activated sludge. A membrane bioreactor retains activated-sludge biomass with microfiltration or ultrafiltration membranes that replace the clarifier. In an integrated MBR wastewater treatment system, the membrane is a solids-separation barrier; it does not biologically remove dissolved contaminants. Polymer carryover, soluble dyes, certain surfactants, and other dissolved compounds may still require biological degradation, adsorption, precipitation, or additional treatment.
The 2019 plant-wide modeling review cited by HydropureWater’s 2026 comparison reported CAS mixed-liquor suspended solids of 2,500–4,000 mg/L, compared with 8,000–12,000 mg/L for MBR; MBR sludge-retention time was commonly 20–40 days. The treatment zones must match the objective: aerobic zones support organic removal and ammonia oxidation, anoxic zones support denitrification, and anaerobic zones address organic load.
| Process element | Conventional activated sludge | Membrane bioreactor |
|---|---|---|
| Biological treatment | Suspended activated sludge | Activated sludge retained in the reactor |
| Solids separation | Gravity clarification and return activated sludge | MF or UF membrane replaces the clarifier |
| Key operating duties | Wasting, RAS control, clarifier performance | Cleaning, TMP control, air scour and replacement |
| Typical flow sequence | Equalization and source control → physical pretreatment → biological treatment → solids separation → optional polishing → discharge or reuse | |
Characterize the Actual Plastics and Rubber Wastewater
The wastewater characterization determines whether MBR belongs on the shortlist, whether CAS remains technically credible, and whether a hybrid train is needed. Sample across representative production conditions and document average, peak, batch, and slug flows rather than sizing from a daily average alone. The test program should cover pH, temperature, COD or BOD, ammonia, nutrients, suspended solids, oil and grease, surfactants, and process-specific polymers, fillers, pigments, and rubber additives. Process inventories and safety data must identify cleaning chemicals and additives that can inhibit biology or foul membranes.
HydropureWater’s 2026 plastics-wastewater comparison supplies a screening rule: COD above 5,000 mg/L or NH3-N above 200 mg/L puts MBR on the shortlist. Below those thresholds, CAS may remain viable if the existing basin is structurally sound and winter nitrification is reliable. This is a screening test, not a final design rule.
Batch dumps, cleaning chemicals, hydraulic shocks, and slug loads can destabilize the biological process and increase membrane fouling. Equalization should be evaluated before biological capacity, but equalization alone does not establish treatability. Membrane retention preserves biomass and can improve biological contact; it cannot make nonbiodegradable, inhibitory, or persistent compounds biodegradable.
The 2024 natural-rubber dataset of 22,158 ± 2,859 mg/L COD therefore describes a demanding case, not a universal plastics or rubber loading. The same 2024 study reported more than 98% COD removal to 118 mg/L through an anaerobic MBR followed by an aerobic/anoxic MBR train. Site testing must determine whether the plant wastewater has comparable biodegradability, inhibitory effects, and operating variability.
| Required input | Why it affects the decision |
|---|---|
| Average, peak, batch and slug flows | Sets equalization, hydraulic and biological capacity |
| COD or BOD, ammonia and nutrients | Determines biological loading and aerobic, anoxic or anaerobic zones |
| Suspended solids, oil and grease, surfactants | Defines separation and pretreatment requirements |
| Polymers, fillers, pigments and rubber additives | Identifies fouling, inhibition and compatibility risks |
| Process inventory and safety data | Links production activities to wastewater chemistry |
A mechanical bar screen for coarse solids can protect downstream equipment, while industrial DAF pretreatment may be justified where analysis confirms oil, grease, floatable solids, or colloidal material. Neither replaces source control, equalization, or biological treatability testing.
Pretreat the Risks Before Comparing Bioreactors
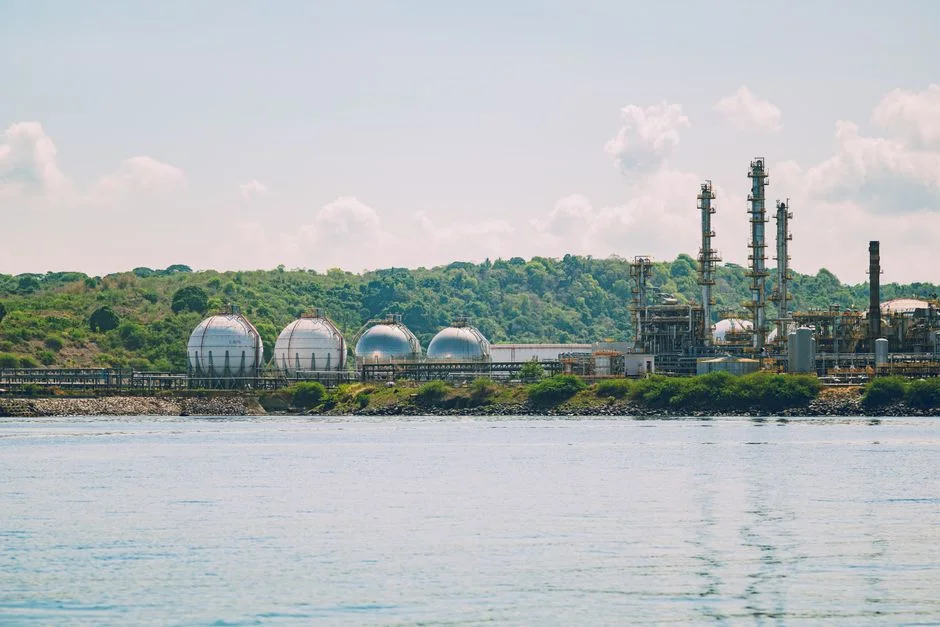
Pretreatment should be assigned to a specific contaminant or hydraulic problem rather than included as an undifferentiated equipment package. Mechanical screening removes coarse solids, rags, plastics, and fibrous debris that could damage downstream pumps, valves, or biological treatment. Equalization addresses production, batch, and cleaning-cycle variability. Neither screening nor equalization makes a persistent or inhibitory compound biodegradable.
DAF should be evaluated when the wastewater analysis supports removal of oil, grease, floatable solids, or colloidal material. HydropureWater’s 2026 comparison reports 4–300 m³/h across its 13 DAF models; that is a product range, not a design flow for a Cambridge plant. Hydraulic and contaminant loading must determine the required capacity.
Chemical dosing requires a defined purpose. An automatic chemical dosing system may support pH control, coagulation, precipitation, or another treatment function, but compatibility, residual effects, and interaction with the proposed membrane must be confirmed before selection.
HydropureWater’s 2026 comparison cites PCI Membranes’ warning that spiral-wound membrane formats are unsuitable for MBR because of their sensitivity to suspended solids. Membrane configuration must therefore follow the solids, oil, polymer, and chemical profile. Where materials repeatedly foul the membrane or interfere with cleaning chemistry, clarification, polishing, or a hybrid train may be more defensible than standalone MBR. A detailed membrane fouling troubleshooting guide can help define which measurements are required during that assessment.
Compare MBR and Conventional Activated Sludge by Plant Condition
MBR and CAS should be compared on solids separation, effluent behavior, land requirements, operating obligations, and site constraints—not on membrane cost alone. CAS depends on secondary clarification, sludge wasting, return-sludge control, and reliable gravity settling. MBR replaces clarifier-dependent separation with MF or UF membrane retention, but adds cleaning, transmembrane-pressure control, air scour, monitoring, and membrane replacement. Its permeate provides a low-solids stream for sensitive discharge, reuse, or downstream RO feed, subject to the applicable specification.
Footprint claims require a defined design basis. PCI Membranes content cited in HydropureWater’s 2026 comparison says higher MBR biomass concentration can produce an up to 50% smaller footprint. HydropureWater’s verified integrated-system catalog separately claims approximately 60% smaller footprint. Both are design-specific and neither should be generalized to every installation.
Energy and carbon comparisons also need boundaries. The 2019 model cited in the 2026 comparison reported direct emissions of 0.85 kgCO₂eq/m³ for CAS and 0.91 kgCO₂eq/m³ for MBR. That narrow difference cannot decide the project without aeration, chemicals, sludge hauling, membrane replacement, downtime, and compliance exposure.
Temperature can alter the biological comparison. HydropureWater’s 2024 industrial comparison reports that at 10 °C, CAS typically loses more than half of its design nitrification rate, while a 20–60-day-SRT MBR maintained more than 80% of design nitrification under the cited conditions. Its stated NH₃-N expectations of below 1 mg/L at warm mixed-liquor temperatures and 3–8 mg/L below 12 °C are design expectations, not guarantees for an unspecified plastics or rubber stream.
| Condition | CAS position | MBR position |
|---|---|---|
| Consistently biodegradable wastewater and reliable settling | Often simpler, with fewer membrane-specific duties | Additional membrane burden may not be justified |
| Unreliable settling or low-solids effluent required | Clarifier and polishing performance become critical | Stronger fit because membrane performs solids separation |
| Reuse or downstream RO | Clarified effluent requires careful solids and scaling review | Permeate is generally a more suitable RO feed |
| Constrained footprint | Casino and clarification area increase | Higher biomass concentration can reduce footprint |
| Oil, polymer, variable loads or persistent fouling dominate | May still work if pretreatment is effective | Requires compatible pretreatment and verified cleaning |
The 2026 MBR cost-per-m³ guide provides useful framing, but the final choice remains conditional on wastewater chemistry and plant objectives.
Build a Cambridge Decision Path from Permit and Reuse Needs

No universal Cambridge or Gaston effluent limit can be inferred from the supplied research. Identify the receiving authority, proposed discharge route, reuse application, plant permit, and internal process, safety, and water-quality requirements, then obtain confirmation of the current requirements from the receiving authority.
For industrial reuse, MBR permeate is generally a more suitable feed for reverse osmosis than clarified CAS effluent because the membrane barrier removes suspended solids and retained solids. RO still requires review of dissolved salts, scaling constituents, organic fouling, and membrane compatibility. An industrial reverse-osmosis water purification system therefore does not remove the need for upstream wastewater characterization or biological treatment.
- If reuse or a low-solids output is required, evaluate MBR with polishing and compatibility testing.
- If the stream is consistently biodegradable, sludge settling is reliable, and land is available, evaluate CAS.
- If oil, polymers, variable loads, or fouling dominate, evaluate a hybrid train with physical pretreatment, biology, and separation assigned to separate duties.
- Include future flow, quality targets, hydraulic reserve, available footprint, energy tariff, sludge-disposal route, and expansion plan.
| Decision condition | Train to evaluate | Required evidence |
|---|---|---|
| Low-solids reuse or sensitive discharge | MBR plus required polishing | Reuse specification, pilot effluent quality and fouling record |
| Reliable biodegradability and settling | CAS with confirmatory settling and biological testing | Seasonal loading, sludge settleability and cold-weather response |
| Oil, polymers or variable foulants | Hybrid pretreatment, biology and separation train | Mass balance, compatibility tests and cleaning evaluation |
A staged investment may install pretreatment and biological capacity first if it preserves the hydraulic and treatment objectives of the final train. Any deferral of membrane capacity should be tied to a defined expansion trigger and verified pilot results, not left as an unpriced assumption.
Pilot with Production Wastewater Before Fixing the Design
A representative pilot establishes whether the selected treatment train can handle the plant’s actual wastewater and operating envelope. Use production wastewater rather than only synthetic water, vary relevant loading, and record biological response, membrane flux, fouling tendency, cleaning frequency, recovered-water quality, and performance during batch or slug-load conditions.
The 2024 rubber-effluent study provides study context, not a universal design guarantee. Phase 1 operated at 42 ± 4 kPa transmembrane pressure and 25 ± 4 LMH flux, with a chemically enhanced cleaning trigger around 50–60 kPa. Suppliers should therefore define normalized flux, design TMP, cleaning method and frequency, expected recovery, chemical compatibility, replacement assumptions, and monitoring requirements.
Performance guarantees should follow representative feed characterization and pilot results. For CAS, the pilot should establish biological response, sludge settleability, solids capture, return-sludge behavior, and seasonal performance. For MBR, it should establish usable membrane area, sustainable flux, cleaning demand, recovery, and stable effluent during production excursions.
Neither system should be sized from flow alone. Hydraulic capacity, biological volume, membrane area, aeration demand, and pretreatment requirements must be derived from flow, organic and solids loads, chemistry, temperature, nutrients, treatment targets, and pilot results. HydropureWater’s integrated MBR catalog range of 10–2,000 m³/day is an initial product screen, not a Cambridge sizing recommendation.
Compare Supplier Proposals on Life-Cycle Value
Comparable bids must expose the assumptions behind each price. Require biological tank volume, membrane area or flux, aeration demand, pretreatment, sludge handling, controls, footprint, installation requirements, and replacement-cycle assumptions. An MBR offer should also identify the proposed configuration, including details comparable to PVDF flat-sheet MBR modules: membrane material, operating flux, TMP limits, cleaning method, recovery, chemical compatibility, replacement-element availability, and controls.
Build a cash-flow comparison covering equipment, installation, energy, chemicals, sludge handling, membrane replacement, labor, downtime, and disposal. The 2026 MBR cost-per-m³ guide can serve as a model, but no defensible project price can be given without average and peak flow, wastewater analysis, pretreatment requirements, aeration demand, membrane area, controls, and site conditions. Any treatment-cost quotation should identify the flow and wastewater profile used in its calculation.
Ask whether the aeration and sludge-retention strategy addresses Cambridge’s seasonal mixed-liquor temperatures, available footprint, and ammonia or nitrogen objectives. Do not rely on a generic energy tariff: obtain local rates and supplier-specific aeration, cleaning, and replacement assumptions. The 2019 direct-emissions comparison—0.85 kgCO₂eq/m³ for CAS versus 0.91 kgCO₂eq/m³ for MBR—is one input, not a standalone carbon or lifecycle-cost conclusion.
| Cost or performance item | Information required in every proposal |
|---|---|
| Installed treatment train | Equipment, installation, controls, utilities and site works |
| Operating resources | Energy, chemicals, cleaning, labor and sludge disposal |
| Lifecycle obligations | Membrane replacement, downtime, controls maintenance and waste routes |
| Basis of quote | Design flow, wastewater profile, treatment target and pilot basis |
| Guarantees | Measured performance, recovery, cleaning assumptions and remedy terms |
Lifecycle comparison also needs to account for the value and risk of reuse. A low-solids MBR stream may support downstream treatment or reduce discharge exposure, but that benefit should be quantified against the actual reuse specification rather than presented as generic “reuse value.”
Frequently Asked Questions
How much does MBR versus conventional activated sludge cost for a plastics or rubber wastewater plant in Cambridge?
A defensible price requires average and peak flow, wastewater analysis, pretreatment requirements, aeration demand, membrane area, controls, and site conditions. Request a written lifecycle breakdown covering equipment, installation, energy, chemicals, sludge handling, membrane replacement, labor, downtime, and disposal. Do not compare a quoted treatment cost unless the supplier identifies the flow and wastewater profile used to calculate it.
Which treatment system should be sized from the 10–2,000 m³/day MBR catalog range?
Neither MBR nor CAS should be sized from flow alone. The 10–2,000 m³/day range is only an initial catalog screen. Establish hydraulic capacity, biological volume, membrane area, aeration demand, and pretreatment requirements using average and peak flow, organic and solids loads, chemistry, temperature, nutrients, treatment objectives, and pilot results.
How should an engineer select an MBR or CAS supplier?
Request normalized flux, TMP limits, cleaning methods, chemical compatibility, expected recovery, replacement-element availability, controls, local service support, and performance guarantees supported by production-wastewater pilot results. For CAS, ask for biological-volume, sludge-settling, solids-handling, seasonal-performance, and wasting assumptions. Use the same wastewater and treatment objectives when comparing offers.
What compliance and reuse requirements should be confirmed before selecting the process?
Identify the receiving authority and confirm the applicable permit or reuse specification directly. No universal Cambridge or Gaston limit can be inferred from the supplied research. The agency review should cover the proposed discharge route, reuse application, production flow, effluent analysis, and pretreatment description. If water is reused within the plant, also obtain the site’s internal process, safety, and water-quality requirements.