Why an Ozone Retrofit Starts With the Energy Bill, Not the Generator
The metric that kills ozone retrofit budgets is kg O₃/h nameplate, and almost every plant I have audited was sized to it. An ozone system is four energy sub-systems stacked in series — corona-discharge generator, feed-gas preparation, contacting and dissolution, and off-gas destruction — and the generator only owns 55–70% of plant-level kWh once feed-gas compression, oxygen generation, cooling-water pumps, and the destruct unit are summed (per the EPA Wastewater Technology Fact Sheet: Ozone Disinfection, 1999, as cited in the ozone oxidation system energy consumption reduction guide). Procurement teams that size only to "kg O₃/h produced" routinely underestimate plant-level load by a factor of 1.4–1.8.
Two numbers must be tracked side by side. Specific energy is kWh per kg O₃ produced at the generator outlet, the figure every vendor quotes. Specific treatment energy is kWh per m³ of wastewater actually treated to the target contaminant removal, the figure the electricity bill responds to. The gap between them widens with poor dissolution, over-dosing, and inefficient off-gas handling, and that gap is where a 2026 retrofit spends its capex. The rule is that the largest of the four sub-systems is rarely the one operators assume, so the first job is to meter the actual kWh landing on each box and target retrofits at the dominant load. The retrofit path is not "buy a bigger generator" — it is to move the energy curve by closing the gap between nameplate and operating specific energy, as detailed in the parallel AOP system retrofit and upgrade guide.
Specific-Energy Bands by Sub-System: Where the kWh Actually Live
Reading the four sub-systems off a parameter table is the fastest way to pick the dominant load on a given site. The generator sets the floor; the other three boxes decide how much of the floor you actually pay for.
| Sub-system | Operating mode | Specific energy (kWh/kg O₃ or as noted) | Dominant cost driver |
|---|---|---|---|
| Corona-discharge generator | Dry air feed | 8–14 kWh/kg O₃ | Cell electrical draw |
| Corona-discharge generator | LOX feed | 5–9 kWh/kg O₃ | Cell electrical draw |
| Corona-discharge generator | VPSA oxygen feed | 4–7 kWh/kg O₃ | Cell electrical draw |
| Feed-gas preparation | VPSA O₂ | 0.3–0.5 kWh per Nm³ O₂ | Compressor / adsorber |
| Contacting and dissolution | Side-stream venturi + PFR | 85–95% gas–liquid transfer (per Mazzei/Jackson data cited in the energy guide) | Pumping energy |
| Contacting and dissolution | Fine-bubble diffusers, deep tank | 60–80% transfer; 20–40% of O₃ lost to off-gas | Blower + lost O₃ |
| Off-gas destruction | Fixed-purge, fixed-heater | 10–25% of destruct own load wasted at part load | Purge air + heater |
| Off-gas destruction | VFD blower + catalytic | Tracks actual off-gas O₃ | Heater trim |
| Cooling loop heat recovery | Plate HEX to boiler/HVAC | 0.5–2% of plant kWh as 25–40 °C heat | Opportunity cost |
The feed-gas line is the second-largest load and is often unmetered. VPSA oxygen typically adds 0.3–0.5 kWh per Nm³ of oxygen produced, which on a 20 kg O₃/h LOX-replacement project can rival the generator's own draw. Air-fed systems under ~5 kg O₃/h rarely justify the VPSA capex; above ~20 kg O₃/h, oxygen-fed almost always wins on kWh/kg O₃ within 3–5 years. On the contacting side, side-stream venturi injection with a pipeline flash reactor routinely achieves 85–95% gas–liquid transfer, versus fine-bubble diffusers in deep tanks that leave 20–40% of generated O₃ in the off-gas and force the destruct unit to burn energy destroying ozone that never participated in treatment. The destruct box, finally, is sized for peak production; without VFD blower control, a unit running at 30% of nameplate still pulls full purge-air flow and heater duty, wasting 10–25% of its own load. A plate heat exchanger on the generator cooling loop will recover 0.5–2% of plant-level kWh as 25–40 °C low-grade heat for boiler feed or HVAC preheating — small in percentage terms, but it rarely shows up on the ozone ledger, so finance should be told.
Retrofit Decision Tree: Five Scopes Engineers Actually Specify

Translating the parameter table into a scope of supply is the next step. The five scopes below are sequenced so the no-capex moves run first and the capital-intensive moves run last, with each step sized against the dominant load rather than against the generator nameplate.
Scope 1 — Dosing-control retrofit (no capex, fastest kWh/m³): a dissolved-ozone probe with closed-loop dose trim holds off-gas O₃ in a 0.1–0.3 ppm band and eliminates the 10–20% over-dose typical of fixed setpoint control. ORP feed-forward layers a second loop on influent UV254 or COD trends, so the system anticipates load rather than reacting to it and smooths peak demand charges. An automatic chemical dosing system for peroxide side-feed integrates directly with existing ozone contactors when peroxone is added later in the sequence.
Scope 2 — Feed-gas switch: air-to-oxygen economics depend on kg O₃/h scale. Air-fed wins below ~5 kg O₃/h, oxygen-fed (LOX or VPSA) wins above ~20 kg O₃/h, with 30–45% kWh/kg O₃ reduction and payback inside five years.
Scope 3 — Contacting upgrade: replace fine-bubble diffusers with a side-stream venturi plus pipeline flash reactor to recover 20–40% of generated O₃ currently lost to off-gas. A packaged HydropureWater ozone generator and tank sterilization system consolidates generator, dosing, and contactor for plants building a parallel skid.
Scope 4 — Generator turndown strategy: modern 2026 units run 10–100% of nameplate, but specific energy rises sharply below 30% load. For plants that swing 2:1 across shifts, two generators at 50% each beat one generator sweeping 25–50%, with 15–25% saving on inefficient partial-load operation.
Scope 5 — AOP pathway addition: evaluate O₃/H₂O₂ (peroxone) first as the lowest-capex AOP retrofit; it requires only a sidestream peroxide pump and a static mixer, and H₂O₂:O₃ mass ratios of 0.3–0.7 are the operating band, with 0.5 the common industrial starting point.
Dose Benchmark: Why 0.7 mg O₃/mg DOC Is the Operating Point to Target
The Warburg WWTP in North Rhine-Westphalia achieved over 80% removal of 14 pharmaceuticals and pesticides at an applied dose near 0.7 mg O₃/mg DOC (per the Oxidation Tech case study cited in the ozone oxidation system energy consumption reduction guide), and that ratio is the operating point to write into the design basis. Poorly tuned systems drift to 1.0–1.5 mg O₃/mg DOC, which doubles kWh/m³ for no incremental removal; the gap between 0.7 and 1.0–1.5 is the wasted-treatment window that the dosing-control retrofit in Scope 1 is designed to close. The Xylem Hammarby Sjöstadsverk pilot showed that pairing ozonation with biological polishing reduced the required O₃ dosage as a primary operating parameter, reinforcing the case that biological polishing downstream of ozone is itself a kWh/m³ reduction strategy rather than a separate scope. For peroxone, ratios above 0.7 waste peroxide and increase residual H₂O₂ in the effluent — a parallel dose-economics argument for holding the 0.3–0.7 band — and biological polishing via the MBR plant operation and maintenance guide removes the residual COD that the AOP did not fully mineralize.
From Ozone Retrofit to AOP Polish: Pathway Selection in 2026
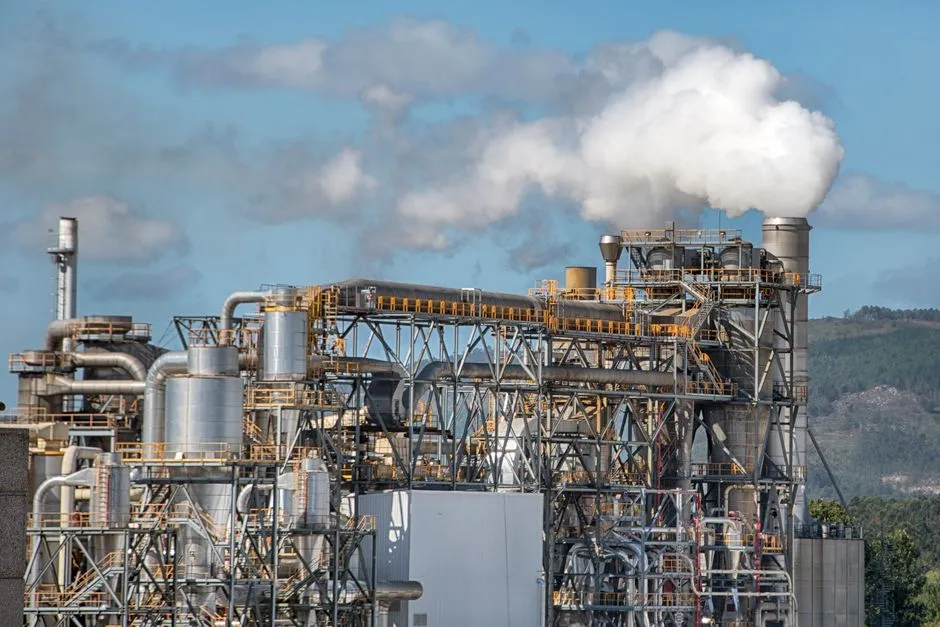
Whether to stop at generator/feed-gas upgrades or step into AOP depends on the influent matrix and the discharge envelope. The pathway matrix below consolidates the operating envelope each option actually delivers.
| Pathway | Best-fit stream | Operating envelope | EE/O or specific energy | Place in train |
|---|---|---|---|---|
| O₃ (generator + feed-gas retrofit only) | Color, refractory organics, textile and landfill leachate | Dose 0.3–0.7 mg O₃/mg DOC; H₂O₂ 5–20 mg/L if peroxone | 2–10 kWh/m³/order, dominated by O₂ feed and generator | Pre-DAF or post-biology, before MBR polish |
| O₃/H₂O₂ (peroxone) | Same as O₃ plus micropollutant polish | H₂O₂:O₃ 0.3–0.7 mass ratio | 30–50% lower kWh than O₃/UV when lamps are aged or cooling-water budget is constrained | Post-biology, pre-MBR |
| Catalytic O₃ (homogeneous or heterogeneous) | Color, refractory organics, lower UV-lamp capex appetite | Catalyst-dependent; pilot EE/O required | Comparable to O₃/H₂O₂ at lower lamp opex | Post-biology, pre-MBR |
| O₃/UV | Micropollutants, reuse-grade color where lamp budget is available | UV dose 20–40 mJ/cm² at 254 nm | Higher kWh than O₃/H₂O₂ when lamps or cooling water are constrained | Post-MBR for reuse-grade effluent |
| UV/H₂O₂ (no ozone) | Low-COD polish, PFAS, no Fenton sludge tolerance | H₂O₂ 5–20 mg/L; UV 20–40 mJ/cm² | <5 kWh/m³/order for low-COD polish | After MBR flat-sheet polish for reuse-grade effluent |
| Fenton / electro-Fenton | High COD (≥1,000 mg/L), Fe-tolerant streams | H₂O₂/Fe²⁺ molar ratio 2–10; H₂O₂ 0.3–1.0× COD | 0.5–3 kWh/m³/order (driven by mixing and pump) | Pre-DAF or post-biology |
| Ultrasound-assisted O₃ | Low-energy decolorization, cavitation-driven •OH | Pilot-confirmed kWh figures only | Pilot-dependent | Side-stream on color streams |
Ozone and O₃-catalytic variants win on color, refractory organics, and textile/landfill leachate streams; UV/H₂O₂ wins on low-COD polishing and PFAS or micropollutants where Fenton sludge is unacceptable; Fenton and electro-Fenton win on high-COD chemical and pharmaceutical streams tolerant of iron catalyst. Catalytic O₃ and O₃/H₂O₂ can match O₃/UV removal at 30–50% lower kWh when UV lamps are aged or when the cooling-water budget for lamp heat rejection is constrained, which is why peroxone is the natural first AOP move on most retrofits. Ultrasound-assisted O₃ targets low-energy decolorization via cavitation-driven •OH formation, but kWh figures should be pilot-confirmed before sizing. For a broader procurement view, the industrial ozone water treatment buyer's guide covers packaged skid selection.
Capex Bands, Payback Windows, and the Integrated Scope
Capex for an AOP retrofit in 2026 runs at 20–60% of greenfield for the same treatment capacity, with an ozone system with off-gas destructor at 25–35% of greenfield and simple payback of 4–7 years at $0.08–0.12/kWh industrial electricity (per the AOP system retrofit and upgrade guide). Chemical opex, not energy, is the dominant line item: H₂O₂ at 70% w/w is the single largest chemical cost on Fenton and UV/H₂O₂ pathways, with O₃ generation power at ~8–12 kWh/kg O₃ the second on ozone pathways. Fenton and UV/H₂O₂ skids install online with parallel piping and a 24–72 hour tie-in outage; ozone system tie-ins or any pathway requiring basin dewatering need longer outage windows.
| Scope element | Equipment | Why it pairs with the ozone retrofit |
|---|---|---|
| Biological step (existing) | Biological reactor, equalization, DAF pretreatment | Stable upstream envelope; AOP polish on top |
| Ozone / AOP skid (new) | Generator, feed-gas, contactor, off-gas destruct, peroxone dosing | Per Scope 1–5 retrofit sequence |
| MBR polish | DF series flat-sheet MBR module (0.1 µm) | Strips residual TSS and COD that the AOP did not mineralize; supports reuse-grade effluent; removable under TCEQ 317 |
| Headworks protection | GX rotary bar screen | Keeps rags and fibers out of new pumps, dosing skids, and MBR piping; plants that skip this typically lose the first six months of uptime to clogged strainers and fouled lamps |
| Post-AOP disinfection | ClO₂ generator for post-AOP disinfection | Pairs cleanly with the AOP skid and avoids the bromate formation that comes from ozonation followed by free chlorine on bromide-rich effluent |
| Integrated MBR package | MBR integrated wastewater treatment unit | Common arrangement where the MBR handles biology and the AOP handles polish, used on pharmaceutical and landfill leachate retrofits with high influent variability |
The default 2026 industrial pattern is biological step → AOP → MBR flat-sheet polish (DF series 0.1 µm), with the GX rotary bar screen at headworks and a ClO₂ generator for post-AOP disinfection. Engineers evaluating a new MBR polish should treat it as part of the same project envelope as the AOP retrofit, not as a separate scope.
Permit Pathway: Why a Skid Retrofit Stays a Process Change
Under TCEQ 317, removable equipment is treated as a process change rather than a redundant-basin trigger, which means an AOP skid generally qualifies as removable and keeps the permitting path simple (per the AOP system retrofit and upgrade guide). A DF series flat-sheet MBR module as the AOP polish step on the back end is also typically removable under the same precedent. Where the new scope requires a permanent basin or anoxic-zone concrete work, the project crosses into a permit modification and should be flagged with the regulator before the bid goes out; plants that skip that conversation typically lose 3–6 months to a permit re-issue. The ozone retrofit scope should be documented as a four-piece submission: design basis with influent and effluent envelopes, contaminant mass balance, hydroxyl radical yield or EE/O proof from bench- or pilot-scale data, and an updated oxidation-power calculation. For site-specific context on the pretreatment side, the Louisville pretreatment compliance guide walks through a comparable envelope exercise.
Frequently Asked Questions
How much does an ozone oxidation system retrofit cost in 2026?
An ozone system with off-gas destructor sits at 25–35% of greenfield capex, and the broader AOP retrofit band runs 20–60% of greenfield depending on pathway (per the AOP system retrofit and upgrade guide). The actual number for a given site depends on kg O₃/h scale, feed-gas choice, contacting style, and how much of the existing biological train is reused, so a vendor proposal with a four-piece design basis submission is the input a buyer must request before fixing a number.
What is the typical payback period for an ozone AOP retrofit?
Simple payback runs 4–7 years at $0.08–0.12/kWh industrial electricity, dominated by H₂O₂ chemical cost on Fenton and UV/H₂O₂ pathways and by O₃ generation power on ozone pathways (per the AOP system retrofit and upgrade guide). The band is heavily dependent on whether the plant is avoiding a discharge penalty or qualifying for a reuse contract, so finance will want the avoided-cost line item priced separately before signing off on the capex.
Should we switch from air feed to VPSA or LOX oxygen?
Air-fed wins below ~5 kg O₃/h, oxygen-fed (LOX or VPSA) wins above ~20 kg O₃/h, with 30–45% kWh/kg O₃ reduction and payback inside five years (per the ozone oxidation system energy consumption reduction guide). Plants in the 5–20 kg O₃/h middle band should size the comparison on their own load factor, electricity tariff, and oxygen supply logistics, since the threshold is not sharp.
How do we choose between O₃/H₂O₂ (peroxone) and O₃/UV?
Catalytic O₃ and O₃/H₂O₂ can match O₃/UV removal at 30–50% lower kWh when UV lamps are aged or when the cooling-water budget for lamp heat rejection is constrained (per the ozone oxidation system energy consumption reduction guide). Peroxone is the lowest-capex AOP retrofit because it only requires a sidestream peroxide pump and a static mixer, and H₂O₂:O₃ mass ratios of 0.3–0.7 are the operating band with 0.5 the common industrial starting point.
Does an ozone retrofit trigger a new discharge permit?
Under TCEQ 317, an AOP skid generally qualifies as removable equipment and is treated as a process change rather than a redundant-basin trigger, which keeps the permitting path simple (per the AOP system retrofit and upgrade guide). The scope must be documented as a four-piece submission — design basis, contaminant mass balance, hydroxyl radical yield or EE/O proof, and updated oxidation-power calculation — and the project only crosses into a permit modification if permanent basin or anoxic-zone concrete work is required, in which case the regulator should be flagged before the bid goes out.