
What SEMI F63 actually says about metals and silica
SEMI F63 is the binding document for any 300 mm fab writing a UPW distribution loop spec, and the four anchor numbers are resistivity ≥18.2 MΩ·cm at 25 °C, TOC <1 ppb, dissolved silica 0.2–1.0 ppb, and particles >0.05 µm counted below 0.3/mL, with bacteria held below 1 CFU/100 mL (S3, summarising F63 and S1). The 18.2 MΩ·cm figure is the theoretical maximum for absolutely pure water at 25 °C and is the baseline every fab spec is written against (S3).
ASTM D5127 (≥18.0 MΩ·cm, TOC <10 ppb) and ISO 3696 Grade 1 (≥10 MΩ·cm, no TOC or particle limit) sit in the same standards stack but are reference points for general electronics and laboratory reagent water, not loop specs (S2, S3). F63 does not assign a single ppb number to metallic ions; it aggregates them as "sub-ppb" because each individual ion — Na, K, Ca, Fe, Cu, Zn, Al — is a distinct failure mode at the wafer surface (S1, S3). Resistivity remains the fastest ionic-contamination alarm on the loop: 0.1 ppb of NaCl drops loop resistivity from 18.18 to 18.11 MΩ·cm (S3), a small but detectable shift that flags ionic breakthrough before particle bridging shows up at sub-7 nm. The pretreatment stage protects the rest of the train from fouling via a multi-media filter for RO pretreatment and SDI control.
Metals on the loop: which ions, which failure modes
The metals that matter on a UPW loop are Na, K, Ca, Fe, Cu, Zn and Al, and F63's "sub-ppb" wording is deliberate because each of them is a yield-loss vector rather than a single bulk parameter (S1, S3). Cu, Fe and Na are the three ions called out in the F63 commentary as deep-level traps in silicon; sub-ppb levels cause junction leakage, DRAM retention failure, and gate oxide integrity loss (S1, S3). Na is the first ion to break through a depleted cation exchanger, which is why an online sodium ion-selective electrode sits at the front of the monitoring stack — conductivity alone cannot see it (S3). Ca and Mg are the ions that drive RO scaling risk and therefore the recovery setting; they are removed in softening plus RO rather than in the polish loop (S1). Fe and Cu typically enter from distribution-loop corrosion rather than feedwater, and material of construction — SS-316L with orbital-welded joints, PVDF, or PP — is the primary control; leachables from solvent-welded plastic piping and O-rings add measurable TOC and ionic contamination if mis-specified (S3). The point-of-use monitoring stack that catches the rest is resistivity plus a sodium ISE plus periodic ICP-MS grab samples for Cu, Fe, Zn and Al at ppb level (S3).
| Ion | Typical loop target | Primary failure mode at the wafer | Stage that owns it |
|---|---|---|---|
| Na | sub-ppb; first to break through cation resin | Junction leakage, mobile-ion contamination (S1, S3) | Cation bed / mixed-bed polish; online ISE alarm (S3) |
| K | sub-ppb | Mobile-ion contamination, surface charging (S1) | Mixed-bed polish (S1) |
| Cu | sub-ppb | Deep-level trap; DRAM retention failure (S1, S3) | Loop material of construction; mixed-bed polish (S3) |
| Fe | sub-ppb | Deep-level trap; gate oxide integrity loss (S1, S3) | Loop material of construction; mixed-bed polish (S3) |
| Ca, Mg | sub-ppb at POU; inlet hardness controlled upstream | RO scaling; sets recovery limit (S1) | Softener + RO (S1) |
| Zn, Al | sub-ppb; tracked by ICP-MS grab sample | Gate stack contamination; yield drift (S1, S3) | Mixed-bed polish + periodic ICP-MS confirmation (S3) |
Silica is three contaminants, not one

"Silica" on a UPW lab report refers to three different contaminants, and treating them as one number hides which unit operation is failing. Dissolved silica, reported as SiO2, is the F63 parameter at 0.2–1.0 ppb; it forms glassy deposits on wafer surfaces during drying steps and shifts threshold voltage and leakage current when it contaminates gate dielectrics (S1, S3). Colloidal silica slips past RO and EDI, scatters light in immersion fluid at immersion-lithography steps, and is the silica fraction that immersion scanners care about most (S1, S3). Particulate silica is governed by the half-feature-size rule: for a 3 nm feature the practical cut is around 1.5 nm, and the distribution loop carries ≤200 nm final filters at point of use (S3). Online colorimetric (molybdate) tracks the dissolved trend; periodic ICP-MS confirms; colloidal and particulate are reported separately because the same number on a report can mean three different upstream problems (S1, S3). The colloidal-silica and bacterial-fragment cut is owned by a 0.01 µm UF for colloidal silica and particle control stage on the polishing train.
Where each metal and silica form is removed in the polishing train
A drift on the loop can be traced to a specific unit operation only if the engineer knows which stage owns which species. Pretreatment (MMF + carbon + softener) protects the RO from fouling and sets inlet SDI; turbidity <0.1 NTU and chlorine <0.1 ppm at the RO inlet are the gate conditions (S1). Industrial RO drops TDS from roughly 500 ppm in feed to 5–25 ppm in permeate and rejects 95–99% of dissolved salts; double-pass is the norm for sub-7 nm fabs because it pushes the EDI feed into the sub-ppb range (S1, S3). EDI polishes continuously without acid/caustic regeneration, sustains >2 MΩ·cm at 90%+ recovery, and is bounded by feed CO2 and silica — the most common operating problems trace to RO feed instability rather than the EDI module itself (S1, S2, S3). Mixed-bed DI / non-regenerable IX is the final ionic polish; UV at 185/254 nm takes TOC to <1 ppb and handles microbial control, with lamp life of 9,000–12,000 hours under continuous duty (S1, S3). UF at 0.01 µm is the colloidal-silica and bacterial-fragment cut, and a ≤200 nm point-of-use filter is the last defence for sub-40 nm features (S3).
| Stage | Owns | Operating limit / output |
|---|---|---|
| Pretreatment (MMF + carbon + softener) | Particles, chlorine, hardness (Ca, Mg) | Turbidity <0.1 NTU; Cl2 <0.1 ppm at RO inlet (S1) |
| Single- or double-pass RO | Bulk dissolved ions, colloids, organics >200 Da | 95–99% rejection; permeate 5–25 ppm TDS (S1) |
| EDI (chemical-free) | Dissolved silica, residual ions, CO2 effect | 15–17 MΩ·cm; silica <5 ppb; bounded by feed CO2 and silica (S1, S2, S3) |
| Mixed-bed / non-regenerable IX | Final ionic polish (Na, K, Cu, Fe, Zn, Al) | Residual ions <0.1 ppb at POU (S1, S3) |
| UV at 185/254 nm | TOC, microbial control | TOC <1 ppb; lamps 9,000–12,000 h (S1, S3) |
| UF at 0.01 µm + ≤200 nm POU filter | Colloidal silica, bacterial fragments, particulates | Colloidal-silica cut; ≤200 nm at sub-40 nm features (S3) |
The chemical-free polishing block is typically a chemical-free EDI polishing module for continuous ion removal, with a dual-wavelength 185/254 nm UV sterilizer sized to the TOC target rather than average flow.
The distribution loop is where the spec is won or lost
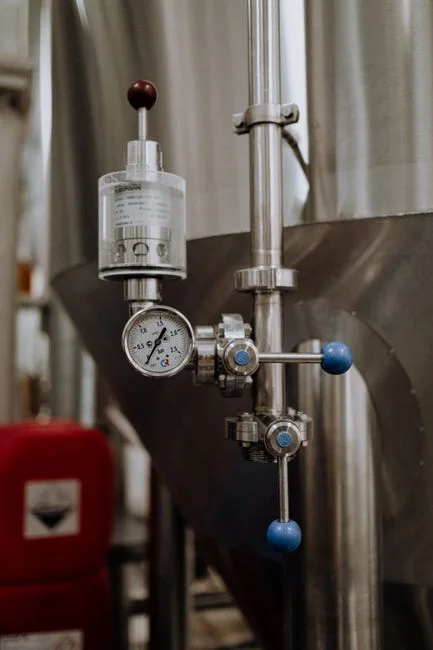
Even a perfect central skid is defeated by a bad loop, because the last 50 m of piping between the central plant and the tool is where most fabs quietly destroy yield (S3). Continuous recirculation is non-negotiable: stagnation breeds biofilm, and biofilm is the largest operational source of particles and TOC excursions on a healthy plant (S3). Material selection on the loop is part of the metals and TOC spec — PVDF, PP, or SS-316L with orbital-welded joints, not solvent-welded plastic, because leachables from mis-specified plastic add measurable TOC and ionic contamination (S3). DO control is a loop problem: a membrane or vacuum degasser in the loop keeps DO <10 µg/L right up to the point of use, because the polishing-tower degasser is too far upstream to protect the last 100 m (S1, S3). Particle control at point of use follows the half-feature-size rule, and at 3 nm the fab is filtering to roughly 1.5 nm at the tool — which is why ≤200 nm final filters sit on the distribution loop, not just at the central skid (S3). The consumables that keep that loop on spec live on a planned replacement schedule for RO membranes and UF cartridges on a planned replacement schedule.
Drift diagnosis: which stage to touch first
When an alarm fires, the question is which stage to touch first, and the answer is set by which parameter is drifting. Resistivity drift on the return loop with no flow change points to CO2 ingress through fittings; check the fittings and the EDI performance before chasing anything else (S3). A sodium alarm on the online ISE almost always means cation-bed exhaustion, not a feedwater problem — verify the bed before re-allocating operators (S3). A silica excursion needs to be split into dissolved versus colloidal before any action: a molybdate colorimetric + ICP-MS pair tells you which is moving; dissolved points to RO recovery or EDI feed CO2, colloidal points to UF integrity (S1, S3). A particle spike at point of use is a filter-and-sanitise job — replace the final filter, sanitise the loop, and trend the laser particle counter against specific tool uptime so the next drift is caught before a lot is exposed (S3). More on the cost side of CMP loop chemistry is in the CMP wastewater treatment cost comparison for 2026.
Frequently Asked Questions
What dissolved silica limit should be written into a 2026 UPW loop spec?
SEMI F63 sets dissolved silica at 0.2–1.0 ppb for a 300 mm fab loop (S3, summarising F63 and S1). Sub-3 nm production treats this as a floor rather than a ceiling, and dissolved and colloidal silica must be reported separately on the lab report (S1, S3).
Which polishing stage actually lowers colloidal silica?
Colloidal silica slips past RO and EDI, so it is not removed by either (S1, S3). The colloidal-silica and bacterial-fragment cut is owned by the 0.01 µm UF (10,000 MW cut-off) on the polishing train, with a ≤200 nm point-of-use filter as the last defence for sub-40 nm features (S3). Buyers evaluating a colloidal-silica excursion should request UF integrity-test data, not a resistivity-only trend.