What an Oxalate Production Plant Actually Makes
An oxalate production plant is a multi-product facility, not a single-chemical asset, and the product slate drives 60–70% of the cost variance between otherwise similar nameplate capacities. Oxalic acid (H2C2O4) is the diacid; sodium oxalate (Na2C2O4), potassium oxalate, and ferrous oxalate (FeC2O4) are its conjugate salts; the trimethyl and dimethyl esters, plus potassium ferrioxalate (K3[Fe(C2O4]3), are specialty derivatives. pKa1 = 1.27 and pKa2 = 4.28 (S5, Wikipedia "Oxalate") dictate the downstream crystallization pH window and the ion-exchange resin loading curves used in polishing trains — a plant targeting pharmaceutical grade (≥99.8% H2C2O4·2H2O) cannot reuse a commodity-grade ion-exchange step without re-specifying resin volume and regeneration duty.
End-markets for the conventional product slate per S5 include rust removal (Fe3+ chelation by oxalate), metal polishing, textile and wood bleaching, rare-earth separation, and oxaliplatin synthesis for oncology — the chelating behaviour of the planar C2O42− ligand is what makes the molecule industrially useful, not the acidity. Pharmaceutical-grade oxalic acid and battery-grade ferrous oxalate (for lithium-ion anode material, S2) typically command 2–4× the commodity price, and that ASP uplift is what justifies the crystallization and purity train a pharmaceutical site must install. When engineers scope a plant against a single product spec, they routinely underestimate the cost of secondary finishing lines — this is where reverse-osmosis polishing of process water, rather than the reaction chemistry itself, becomes the budget line that quietly doubles. RO polishing of the dilution water used in crystallization is a useful reference point — see RO water purification for oxalic acid crystallization as the process-water specification that gates pharmaceutical-grade output.
The Three Routes That Set the Cost Baseline
"Oxalate plant cost" is meaningless without picking a synthesis route, because CAPEX varies 3–5× across routes at the same nameplate capacity. The three commercial routes and one emerging route are:
Route 1 — Nitric acid oxidation of carbohydrates (glucose or sucrose). The dominant industrial route. Concentrated HNO3 oxidizes the carbohydrate in a stirred tank at 60–75 °C under reflux, with V2O5 or Fe3+ as catalyst. The exotherm and the NOx off-gas are the CAPEX drivers: a stainless-clad reactor with brine-cooled coils, a wet scrubber for NOx abatement, and an HNO3 recovery column typically absorb 35–40% of the total installed cost for a Tier 2 plant.
Route 2 — Sodium formate pyrolysis to sodium oxalate. Lower exotherm, smaller reactor, and tighter temperature control (≈400 °C in a fluidized bed). The product is sodium oxalate, which is acidified to oxalic acid only if the merchant market requires the diacid. CAPEX per tonne of Na2C2O4 is lower than Route 1, but OPEX is more energy-intensive.
Route 3 — Ferrous oxalate from acidic iron wastewater. The route published in 2025 in Journal of Materials Chemistry C (RSC, d4tc03455d) recovers acidic iron-bearing effluent as a sellable FeC2O4·2H2O anode precursor for lithium-ion batteries. Feedstock is a waste stream, not a purchased carbohydrate, and the reaction is neutralization plus crystallization rather than oxidation. This route is only viable at sites with a captive iron waste stream (steel pickling, battery-precursor precursor lines, electronics etching), and the anode-grade product commands a price premium that distorts the OPEX comparison in its favour.
Route 4 (emerging) — Microbial oxalic acid production. A 2026 Microbiology paper (S4) confirmed that Escherichia coli K-12 MG1655 produces oxalic acid under Pb and Cd stress, with HPLC-verified output and bioaccumulation efficiencies of 99.94% for Pb and 97.77% for Cd at 1,000 ppm. The route is not yet industrial but compresses the CAPEX for the reactor train at lab scale and reframes oxalate as a co-product of bioremediation rather than the primary output.
Stoichiometric note: the theoretical yield of oxalic acid from glucose is ≈1.6 t per t glucose, but practical yield sits at 1.0–1.2 t/t because of incomplete oxidation and over-oxidation to CO2. Any feed-cost calculation must be sized off practical, not theoretical, yield. DAF pre-treatment for oxalate plant effluent typically handles the suspended catalyst and unreacted carbohydrate before the wastewater train.
| Route | Dominant CAPEX line | Typical yield (practical) | Effluent profile | 2026 industrial status |
|---|---|---|---|---|
| 1. HNO3 oxidation of glucose/sucrose | Reactor + NOx scrubber + HNO3 recovery | 1.0–1.2 t/t carbohydrate | 8–15 m3 weak acidic NO3 effluent per t product | Dominant |
| 2. Sodium formate pyrolysis | Fluidized bed + temperature control | ~0.95 t/t sodium formate | Lower volume, carbonate-rich | Niche, China-led |
| 3. Ferrous oxalate from iron wastewater (S2, RSC 2025) | Neutralization + crystallization train | Set by Fe content of waste | Near-zero liquid effluent; solids handled | Emerging, battery-grade |
| 4. Microbial (S4, Microbiology 2026) | Bioreactor + downstream recovery | Lab-scale only | Spent biomass + metal-loaded solids | Pilot |
CAPEX Breakdown by Plant Size in 2026
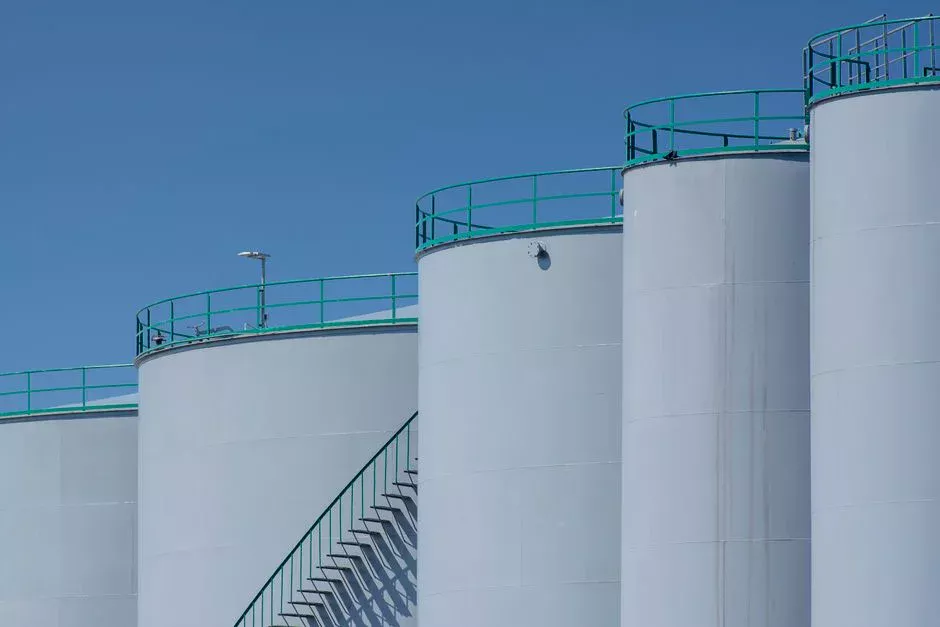
A 2026 oxalate plant in the 500–5,000 t/yr range typically costs USD 2.5–14 million in total CAPEX on the conventional nitric-acid route, with the headline number clustering around USD 4,000–8,000 per tonne of annual nameplate capacity. Three tiers cover the realistic industrial envelope:
Tier 1 (≤500 t/yr, pharma/electronic grade). USD 6–14 M total CAPEX. Crystallization (multi-stage vacuum) and purification trains (ion-exchange + recrystallization) dominate at ~45% of the installed cost, because the purity premium is paid in equipment, not reagents. The smallest viable economic scale for a pharmaceutical-grade H2C2O4·2H2O plant sits around 200 t/yr.
Tier 2 (500–5,000 t/yr, industrial grade). USD 2.5–9 M total CAPEX. The reactor and the HNO3 recovery column dominate at ~50% of the installed cost; crystallization drops to ~25% because purity tolerance widens. This is the most common procurement envelope in 2026 industry inquiries.
Tier 3 (5,000–20,000 t/yr, commodity). USD 18–45 M total CAPEX, typically outside the published mainland-China price band because the on-site wastewater denitrification train, NOx abatement, and reagent-recovery loops add USD 5–10 M. A commodity oxalic acid plant below 5,000 t/yr rarely clears the ASP in 2026 because feedstock + nitric acid alone push variable cost above the merchant price floor.
Itemized cost lines to budget: main reactor, HNO3 recovery column, multi-stage vacuum crystallizer, centrifuge and dryer, packaging, wastewater treatment, instrumentation and DCS, and an EPC margin of 15–22% added to the equipment sum. Currency caveat: most published 2025–2026 figures are in RMB; the USD figures here use ~7.2 RMB/USD without disclosing a specific source date, and they should be sanity-checked against any vendor quotation. The ROI calculator for industrial wastewater treatment baseline (USD 429) is the lowest-cost reference in our catalog and is useful only as a sanity check, not a primary CAPEX anchor. Wet scrubbers for NOx abatement in the nitric acid oxidation route typically account for 8–12% of Tier 2 installed cost.
| Cost line | Tier 1 ≤500 t/yr | Tier 2 500–5,000 t/yr | Tier 3 5,000–20,000 t/yr |
|---|---|---|---|
| Main reactor (clad, cooled) | USD 0.8–1.6 M | USD 0.6–2.0 M | USD 4–8 M |
| HNO3 recovery column | USD 0.4–0.8 M | USD 0.5–1.5 M | USD 3–6 M |
| NOx scrubber | USD 0.3–0.6 M | USD 0.4–1.0 M | USD 2–4 M |
| Crystallizer (multi-stage vacuum) | USD 1.5–3.0 M | USD 0.6–1.8 M | USD 3–7 M |
| Centrifuge, dryer, packaging | USD 0.6–1.5 M | USD 0.4–1.0 M | USD 2–4 M |
| Wastewater treatment (incl. denitrification) | USD 1.0–2.5 M | USD 0.3–0.8 M | USD 2–6 M |
| Instrumentation / DCS / EPC margin (15–22%) | USD 1.4–4.0 M | USD 0.7–2.0 M | USD 4–10 M |
| Total CAPEX (2026 USD) | USD 6–14 M | USD 2.5–9 M | USD 18–45 M |
OPEX: What Moves Operating Cost Per Tonne
Variable OPEX on the conventional nitric-acid route clusters at USD 380–620 per tonne of oxalic acid equivalent in 2026, with the spread driven almost entirely by carbohydrate feedstock and nitric acid prices. The breakdown, drawn from operating cost envelopes seen across 2024–2026 procurement data:
Carbohydrate feedstock (glucose or sucrose, sized off the practical yield of 1.0–1.2 t oxalic acid per t carbohydrate) accounts for USD 140–220 per tonne. HNO3 consumption (≈0.7–0.9 t per t oxalic acid on the optimized route) accounts for USD 80–130 per tonne. Energy is dominated by crystallization steam (3-stage vacuum, ~1.2 t steam per t water removed) and compressor duty for NOx scrubbing; budget USD 50–90 per tonne. Direct labour for a Tier 2 plant runs USD 30–55 per tonne, maintenance USD 25–45 per tonne, and wastewater treatment USD 30–80 per tonne depending on whether denitrification is required. Feedstock + acid together account for 55–70% of variable cost; hedging both contracts is the single largest OPEX lever a project developer has.
For the ferrous oxalate from iron wastewater route (S2), variable cost drops to USD 220–340 per tonne because nitric acid is replaced by neutralization with a waste-derived iron salt and the feed is a captive effluent stream. The S2 paper specifically demonstrates that the resulting FeC2O4·2H2O meets anode-grade specification with superior long-cycling lithium storage, which justifies the lower volume. A 2026 plant with on-site PLC-controlled chemical dosing for oxalate plant wastewater typically drops the wastewater line by 15–25% versus manual dosing. The energy line item is the easiest to under-budget: a 3-stage vacuum crystallizer running 24/7 at 5,000 t/yr draws ~1.8–2.2 MW of thermal duty, and the scrubber compressor another ~0.4 MW. Chemical cost optimization tactics for oxalate plant wastewater cover the reagent-side levers that move the wastewater line by 20–40% without capex.
| OPEX line | USD per tonne oxalic acid equivalent (Route 1, 2026) | USD per tonne (Route 3, ferrous oxalate from iron wastewater) |
|---|---|---|
| Feedstock (carbohydrate or iron waste) | 140–220 | 0–30 (captive waste) |
| Nitric acid | 80–130 | 0–20 (neutralization only) |
| Energy (steam + scrubber) | 50–90 | 35–70 |
| Direct labour | 30–55 | 25–45 |
| Maintenance | 25–45 | 20–35 |
| Wastewater treatment | 30–80 | 20–50 |
| Total variable OPEX | 380–620 | 220–340 |
Matching the Plant to Your Site Conditions
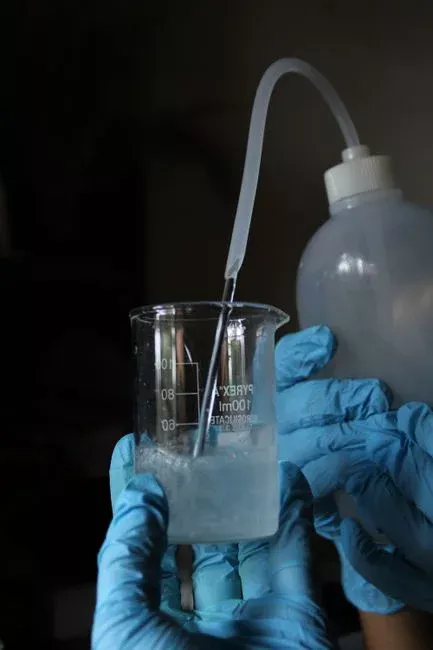
The CAPEX and OPEX bands above are envelope numbers; the project decision lives in site-specific conditions. Four site conditions move the answer materially:
Existing acidic iron waste stream. If the site already operates steel pickling, electronics etching, or battery-precursor lines, the S2 ferrous oxalate route converts a hazardous waste into a sellable battery-grade product and shifts the OPEX curve down 15–25%. Ion exchange energy reduction for oxalic acid polishing is a useful parallel lever for any plant chasing the last 10% of variable cost.
Pharma or battery-grade end-market. If the off-take is oxaliplatin precursor (S5) or FeC2O4·2H2O lithium-ion anode material (S2), capex per tonne is 2–3× higher than commodity because the crystallization and ion-exchange train is over-sized, but ASP supports it. A 1,000 t/yr pharmaceutical-grade plant clears merchant economics where a 1,000 t/yr commodity plant does not.
Tight NO3 discharge limits. Sites in Germany, the Netherlands, South Korea, and California face total nitrogen limits below 15 mg/L in the discharged wastewater. Budget an extra USD 1.2–2.5 M for a denitrification stage in the wastewater train, which adds ~USD 20–35 per tonne to the wastewater line. Wastewater chemical cost optimization tactics cover the reagent-side levers that keep this line in check.
Captive supply for in-house rust removal or water treatment. For chemical or fine-chemicals operators who consume 200–800 t/yr of oxalic acid internally, a captive plant typically beats merchant purchase at 18–24 month payback, before any logistics savings. The simplest commercial decision in 2026 is whether the iron-waste option is available; if it is, the payback compresses to 12–16 months.
Frequently Asked Questions
What is the 2026 CAPEX for a 1,000 t/yr oxalic acid plant on the nitric acid route?
A 1,000 t/yr Tier 2 industrial-grade plant on the nitric acid oxidation route sits in the USD 4–7 M total CAPEX band, with the reactor + HNO3 recovery column at ~50% of the installed cost, the crystallizer at ~25%, and the wastewater train + EPC margin accounting for the rest. Pharmaceutical-grade purification adds USD 2–4 M.
What is the operating cost per tonne of oxalic acid in 2026?
Variable OPEX on the conventional nitric acid route is USD 380–620 per tonne of oxalic acid equivalent, with carbohydrate feedstock (USD 140–220) and nitric acid (USD 80–130) together accounting for 55–70% of the total. The ferrous oxalate from iron wastewater route drops variable cost to USD 220–340 per tonne because feed is captive waste and acid is replaced by neutralization.
How much wastewater does an oxalic acid plant generate per tonne of product?
Every tonne of oxalic acid produced on the nitric acid route generates 8–15 m3 of weak acidic effluent with residual NO3 and dissolved catalyst metals. Treat via denitrification plus neutralization; direct discharge is not viable in jurisdictions enforcing total nitrogen limits below ~15 mg/L.
What is the typical ROI on a 2,000 t/yr ferrous oxalate plant using acidic iron wastewater?
At 2,000 t/yr of battery-grade FeC2O4·2H2O with the iron feed sourced as a captive waste, total CAPEX of USD 3–6 M and variable OPEX of USD 220–340 per tonne, simple payback against merchant anode-grade ferrous oxalate prices typically lands in the 12–24 month range, with the upper end of the band applying where reagent recovery and denitrification capex are required.
How long does permitting take for a new oxalate plant in the EU and US?
Permitting for a new chemical plant with on-site HNO3 storage, NOx emissions, and NO3-bearing wastewater typically takes 18–36 months in the EU under the Industrial Emissions Directive (2010/75/EU) and 12–24 months in the US under the Clean Air Act and Clean Water Act NPDES framework, with the German and California tracks at the longer end. A ferrous oxalate route using an existing iron waste stream often shortens the waste-related permit review by 3–6 months because it converts a regulated waste into a product.