Why MBBR Is the Workhorse for Pulp and Paper Effluent
An MBBR designed for pulp and paper wastewater is normally deployed as the high-loaded front end of a Biofilm-Activated Sludge (BAS) train and is sized to remove 30–60% of the incoming soluble COD before a downstream activated-sludge polishing stage. Peer-reviewed 2021 data from a 1-year Södra Cell Värö BAS study show that at 4.9 h HRT with excess nutrients the MBBR removes about 50% of sCOD, that a threefold increase in carrier fill ratio can cut reactor volume by 33%, and that the Kincannon–Stover maximum substrate utilization rate reaches 30.6 kg sCOD/(m³·d).
The pulp and paper (P&P) industry is one of the most water-intensive industrial sectors in the world. EU and US mills alone generated approximately 2.5 billion m³ of wastewater in 2015, equal to roughly 42% of the industrial wastewater total in those regions (Matheus et al., 2021, S4). The influent carries degradation products of carbohydrates, lignin, and wood extractives — high COD and BOD, high TSS, chlorinated organics where bleaching is not ECF, and a dark brown colour that signals residual lignin. The BOD/COD ratio typically falls between 0.05 and 0.5, which is a direct indicator of a large recalcitrant fraction that resists conventional biological treatment (S4). Nitrogen and phosphorus are routinely deficient relative to the carbon load, so supplementation is required to keep the culture alive (S4).
MBBR sidesteps the washout problem that plagues suspended-growth reactors. Biomass grows attached to plastic carriers with 200–1,200 m²/m³ of protected surface area, and those carriers move freely in the reactor — kept in suspension by coarse-bubble aeration in aerobic zones or by mechanical mixers in anoxic/anaerobic zones (S4). Because the sludge age is decoupled from hydraulic retention time, shock loads do not wash out the culture, and no external sludge-recycle line is required. Compared to conventional activated sludge, MBBR wins on three points that matter in a brownfield mill: very low head loss, more compact reactor volume at the same sludge age, and easy retrofitting into existing aeration basins (S4).
P&P Wastewater Characteristics the Design Must Respect
Before any sizing calculation, the influent envelope has to be measured at the mill, not pulled from a textbook. The Södra Cell Värö data set, which underpins most of the public MBBR-for-P&P design guidance, is the most-cited full-scale reference: an integrated pulp and paper mill feeding 18,000 m³/d nominal and 34,000–37,000 m³/d design flow into a 4,000 m³ MBBR with 20,000 m³ downstream activated sludge (S4). That envelope is the practical baseline; specific values for COD, BOD, colour, and TSS vary with furnish (recycled vs. virgin fibre), bleaching chemistry, and water-reuse rate.
The contaminants of concern that arrive at the MBBR after primary clarification are chlorinated organics (where bleaching is not elemental-chlorine-free), wood extractives (resin acids, fatty acids), and suspended fibre carry-over from the primary clarifier underflow. MBBR is a secondary treatment stage, not a primary one — unclarified pulp liquor will foul carriers, so DAF or sedimentation upstream is non-negotiable. The 2014 pilot work by de Oliveira et al. confirmed that a clear sequence — primary decanting, pH adjustment, nutrient addition, cooling to thermophilic range, then MBBR — is required to keep the biofilm healthy (S5).
Nutrient-limited operation is now the design default, not an option. Limiting either N or P boosts the sCOD/N and sCOD/P utilization ratios by up to 1.72× and 2.45× respectively under the right HRT, which means lower chemical cost and a less nutrient-laden effluent to discharge (S4).
| Parameter | Typical P&P Influent Range | Design Implication |
|---|---|---|
| COD (total) | 800–3,000 mg/L (mill-specific) | Drives volumetric loading rate; only sCOD is bioavailable |
| BOD/COD ratio | 0.05–0.5 (S4) | Lower ratio = more recalcitrant load; MBBR protects AS from shock |
| TSS | 200–1,000 mg/L post-primary | Must be DAF- or settler-clarified before MBBR |
| Total Nitrogen | Low (often <10 mg/L as N) | Requires dosing; design sCOD:N ≈ 100:0.70 (S4) |
| Total Phosphorus | Low (often <2 mg/L as P) | Requires dosing; design sCOD:P ≈ 100:0.14 (S4) |
| Temperature | 25–55 °C (thermophilic range possible) | Cooling may be required upstream of MBBR (S5) |
| Colour | Dark brown (lignin-derived) | Residual colour carries to MBR/polishing, not MBBR's job |
The BAS Process Train: How P&P Mills Actually Run MBBR
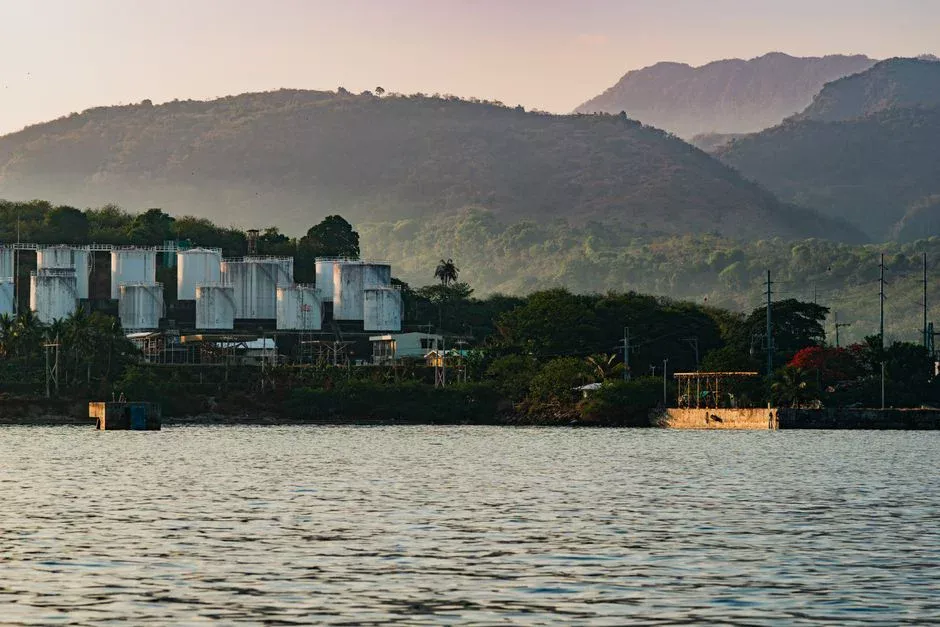
No full-scale P&P plant in the public literature runs an MBBR in isolation. The dominant topology is Biofilm-Activated Sludge (BAS): a high-loaded MBBR as the front end, followed by a conventional activated-sludge reactor as the polishing stage. Multiple pilot and full-scale references confirm this configuration, including the Södra Cell Värö plant (S4) and the corpus of BAS data reviewed by Matheus et al. (2021).
The design intent is straightforward: the MBBR strips 30–60% of the incoming soluble COD before the activated-sludge stage, which (i) shields the AS basin from diurnal load shocks, (ii) suppresses filamentous growth that causes bulking and poor settling, and (iii) yields biosolids with good separability downstream (S4). By removing the readily biodegradable COD upfront, the AS effluent — which already lacks easy substrate — selects for slow-growing organisms capable of consuming the recalcitrant lignin-derived organics that survive the MBBR. The result is a more compact overall plant than a single AS reactor designed for the same sludge age (S4).
The Södra Cell Värö plant is the anchor reference. The MBBR volume is 4,000 m³, filled to 19% with AnoxK™Chip P carriers (900 m²/m³ protected area), followed by a 20,000 m³ activated-sludge basin. Design flow is 34,000–37,000 m³/d, with a nominal operating flow of 18,000 m³/d. At those numbers the MBBR HRT sits in the 2.6–2.8 h window at design flow, which lines up with the HRT window where the lab reactors removed ~50% of sCOD under excess nutrients (S4).
Nutrient limitation does extra work in a BAS configuration. The N- or P-limited MBBR biomass produces more extracellular polymeric substances (EPS), creating a slimy, easily hydrolysed floc that the downstream AS readily degrades. The net effect is N and P recycled back to the process, less waste activated sludge, and a less nutrient-rich final effluent (S4). For 2026 P&P projects targeting tighter nutrient caps, this is a meaningful design lever, not a side note.
MBBR Design Parameters: HRT, Fill Ratio and Carrier Area
The 1-year lab study by Matheus et al. (2021) is the most defensible public dataset for sizing a P&P MBBR. Two parallel reactors — A at 15% carrier fill, B at 45% fill — were fed real Södra Cell Värö wastewater across HRTs of 1.6 to 4.9 h, under both nutrient-excess and nutrient-limited phases (S4). The headline results give the engineer the actual design window:
- At 4.9 h HRT with excess N+P, both reactors removed approximately 50% of sCOD, essentially all of the biodegradable fraction.
- At 1.6 h HRT with 45% fill, sCOD removal dropped to 32% — contact-time limited, not overload-limited.
- 3.2 h HRT at 45% fill matched the 4.9 h performance at 15% fill, delivering a 33% volume saving at equivalent removal (S4).
The Kincannon–Stover kinetic constant from the same dataset is K = 30.6 kg sCOD/(m³·d), more than double the highest apparent removal rate observed (≤14.1 kg sCOD/(m³·d)). That gap is the designer's headroom: the reactor is rarely loaded to its intrinsic maximum, so there is room to push fill ratio or shorten HRT before kinetics become the bottleneck (S4).
For thermophilic operation, de Oliveira et al. (2014) reported stable pilot data at VOL = 4.3 kg sBOD/(m³·d) and SOL = 43.8 g sBOD/(m²·d) at 10% fill, 2 mg/L DO, with 56% sBOD and 35% sCOD removal and no carrier fouling across the study (S5). That work confirms high-temperature MBBR is viable if cooling upstream is provided.
The practical sizing loop is: pick a target sCOD removal (typically 30–60%); set an HRT inside the 3.2–4.9 h proven window; choose a fill ratio (15–45%); iterate until the required reactor volume and carrier area converge.
| Design Lever | Proven Range (S4) | Effect |
|---|---|---|
| HRT | 1.6–4.9 h (lab); 2.6–2.8 h (Södra full-scale) | Longer HRT → higher sCOD removal, higher suspended fraction |
| Carrier fill ratio | 15–45% | 3× fill ratio at 3.2 h matched 4.9 h at low fill = 33% volume saving |
| Kincannon–Stover K | 30.6 kg sCOD/(m³·d) | Maximum substrate utilization rate (kinetic ceiling) |
| Apparent removal rate | ≤14.1 kg sCOD/(m³·d) | Observed operating range; ~2× headroom remains |
| sCOD removal (excess N+P, 4.9 h) | ~50% | Near-complete biodegradable fraction removal |
| sCOD removal (1.6 h, 45% fill) | 32% | Contact-time limited, not overload limited |
| Suspended biomass fraction | 8.6% (1.6 h) to 30% (4.9 h) | Biofilm does not do all the work; long HRT shifts activity to suspension |
Carrier Selection: Why AnoxK™Chip P and High-Area Media Dominate
Carrier protected surface area is the single biggest lever for MBBR compactness. The standard envelope across commercial carriers is 200–1,200 m²/m³ of dry bed, and that range is wide enough to swing reactor volume by a factor of three at the same fill ratio (S4).
Older P&P MBBRs operated at an effective specific surface area (carrier area × fill ratio) of only 60–223 m²/m³, which is one reason the legacy plants are large. Modern designs using AnoxK™Chip P or equivalent high-area media reach up to roughly 600 m²/m³ at high fill, almost an order of magnitude above the legacy envelope (S4). The Veolia AnoxKaldnes MBBR product line is the de-facto industry reference in both research and full-scale plant data (S3, S4). For a buyer or EPC, the practical message is: specify the protected surface area in m²/m³, not the brand name, and design to a target effective specific surface area rather than a fill ratio alone.
For context only — not as a P&P benchmark — the Kaldnes K1 media tested on laundry wastewater at 20% fill and 10-day HRT achieved 91% BOD and 93.81% COD removal (Kusuma et al., 2019, S1). The matrix is different (surfactant- and phosphate-rich laundry effluent), but the data confirms how strongly media type and HRT interact on a different wastewater.
Worked Sizing Example Using the Södra Cell Värö Reference Plant
The Södra Cell Värö numbers are the cleanest full-scale anchor available. At design flow of 34,000–37,000 m³/d and MBBR volume of 4,000 m³, the MBBR-only HRT is 4,000 m³ ÷ 35,500 m³/d ≈ 0.113 d ≈ 2.7 h (S4). That is well inside the 3.2–4.9 h window where the lab reactors hit ~50% sCOD removal under excess N+P (S4).
The effective specific surface area in the full-scale Södra MBBR is 900 m²/m³ (AnoxK™Chip P protected area) × 19% fill ≈ 170 m²/m³, which is at the upper end of the 60–223 m²/m³ envelope reported for previous BAS studies but well below the 600 m²/m³ achievable with the same media at high fill (S4). The implication is that even the reference full-scale plant has unused headroom on carrier area — a retrofit to higher fill or a higher-area chip would shrink the MBBR volume further without changing the removal target.
The volumetric loading rate depends on the mill's actual influent sCOD, but at typical P&P strengths the operating VLR on the Södra MBBR sits in the same band as the apparent removal rate reported by Matheus et al. (≤14.1 kg sCOD/(m³·d)), so the reactor is operating at roughly half of its Kincannon–Stover ceiling (S4). The fill-versus-HRT equivalency is the back-of-envelope sizing tool: a designer who needs 50% sCOD removal and wants to shrink the tank can trade 1.5 h of HRT for a 3× higher fill ratio (3.2 h at 45% fill ≈ 4.9 h at 15% fill).
This example is for orientation only. The reader must verify influent sCOD, temperature, DO, and nutrient profile against local mill data before any equipment order.
Nutrient Dosing, Aeration and Temperature Controls

The minimal nutrient ratio that prevents process failure in a P&P MBBR is sCOD:N:P = 100:0.70:0.14, observed at N-limited operation and 4.9 h HRT (S4). That is the design lower bound, not the operating target — actual dosing is set by influent residual N and P measured at the mill, with the goal of running as close to the limit as effluent permit allows.
Nutrient restriction is not a penalty, it is a feature. Limiting N or P boosts the sCOD consumption ratio for the limited nutrient by up to 2.65×, and for the abundant nutrient by up to 1.70×, because the cells become more efficient per unit of nutrient when one is scarce (S4). The trade-off is slower kinetics, so the HRT must be long enough to compensate.
Dissolved oxygen is the second operational dial. The thermophilic pilot ran at DO = 2 mg/L, which is the typical lower bound for aerobic MBBR to keep the biofilm active without excessive aeration energy (S5). Aerobic MBBRs use coarse-bubble aeration for both oxygen delivery and carrier mixing; anoxic and anaerobic stages use mechanical mixers instead (S4).
Temperature control matters more than most designs acknowledge. P&P warm water can hit 50–55 °C, which is outside the conventional mesophilic window. The 2014 pilot demonstrated stable MBBR operation under thermophilic conditions provided the upstream sequence includes primary decanting, pH adjustment, nutrient dosing, and cooling before the biological stage (S5). One last point that catches designers out: at long HRT (4.9 h) the suspended biomass can reach 30% of total activity, while at short HRT (1.6 h) only 8.6% — so the biofilm does not do all the work, and a pure biofilm assumption underestimates capacity (S4).
Upstream and Downstream Integration: DAF, Sludge Handling, and MBR Hybrids
A 2026 MBBR-for-P&P design is not a single-reactor question; it is a process-train decision. Upstream, mills with high TSS, FOG, or fibre carry-over need a dissolved air flotation stage ahead of the MBBR. The HydropureWater DAF system handles 4–300 m³/h and is proven in pulp and paper applications for removing suspended fibre and pitch before the biological stage.
On the sludge side, a BAS produces less waste activated sludge than a standalone AS at the same influent load, but the WAS still has to be dewatered. The HydropureWater plate and frame filter press is sized for the WAS flow and capture-rate envelope typical of a P&P mill. For a broader view of how sludge handling fits into the train, the wood processing wastewater sludge treatment guide walks through the full dewatering train.
For mills targeting water reuse or zero liquid discharge, the MBBR + MBR hybrid is the recommended 2026 topology. The 2021 review by Patel et al. concludes that coupling MBBR with MBR makes energy and water recovery feasible and is the most promising path for ZLD compliance in P&P (S2). The MBR stage can be sized using the HydropureWater integrated MBR system at 10–2,000 m³/d when the mill is moving toward closed-loop water. For EPC consultants comparing vendor options, the industrial wastewater treatment comparison framework is a useful side reference. The headline: 2026 P&P projects are sized as a process train (DAF → MBBR → AS → MBR/disinfection → sludge dewatering), not as a standalone MBBR.
Frequently Asked Questions
What HRT should I use for an MBBR on pulp and paper wastewater?
For 30–60% sCOD removal in a BAS front end, target 3.2–4.9 h HRT. The 1-year Matheus et al. (2021) study hit ~50% sCOD removal at 4.9 h under excess N+P, and matched that performance at 3.2 h by raising the fill ratio from 15% to 45% (S4). Below 3 h, removal drops sharply unless carrier area is increased to compensate.
Can MBBR alone meet P&P discharge limits, or do I need a downstream stage?
MBBR alone typically achieves 30–60% sCOD removal, which is rarely enough to meet P&P effluent COD limits. The full-scale topology is BAS — MBBR front end followed by an activated-sludge polishing stage — which is the configuration used at Södra Cell Värö (4,000 m³ MBBR + 20,000 m³ AS at 34,000–37,000 m³/d) and is the standard recommendation in the 2021 review literature (S4, S2).
What carrier fill ratio should I specify?
15–45% is the proven range for P&P (S4). The fill-versus-HRT rule is the key sizing lever: 3.2 h at 45% fill matches 4.9 h at 15% fill, delivering roughly 33% volume saving at equivalent sCOD removal (S4). With modern high-area carriers (900 m²/m³ protected area), higher fill is the more compact option for greenfield design.
How are N and P dosed?
Under N-limited operation the design lower bound is sCOD:N:P = 100:0.70:0.14, observed at 4.9 h HRT in the Matheus et al. (2021) dataset (S4). Limiting N or P boosts the sCOD consumption ratio for the limited nutrient by up to 2.65× and reduces nutrient discharge in the final effluent (S4). Actual dosing is set by influent residual N/P and the mill's effluent permit.
Can MBBR be retrofitted into an existing activated-sludge basin?
Yes — and that is one of its main advantages. MBBR operates with very low head loss and does not require a sludge-recycle line, so carriers can be added to an existing aeration tank with minimal hydraulic modification (S4). Multiple BAS retrofits are documented in the literature, and Södra Cell Värö itself is a brownfield BAS configuration built around an existing AS basin. For a 2026 retrofit checklist, the MBBR stage typically slots in as a new cell upstream of the existing AS, with DAF pretreatment if TSS is high.