What 'Reliable' Actually Means in Industrial Wastewater Treatment
A wastewater train is reliable when it does four measurable things, every shift, for at least 15 years: it stays inside the discharge permit, it keeps mechanical uptime above 95%, it produces effluent within ±10% of design, and it holds total CAPEX+OPEX inside the approved project envelope. A system that hits three of the four but blows the lifecycle budget is not reliable, it is a liability. A system that hits the budget but misses BOD5 by 20% on a Friday afternoon is a shutdown risk.
The benchmark a 2026 spec should measure against is the U.S. EPA horizontal-flow constructed-wetland target: 30 mg/L BOD5 and 30 mg/L TSS at inflow loads of 6 g BOD₅/m²/d and 20 g TSS/m²/d respectively (Vymazal, Water, 2010-08, Section 2.2). The S2 review tracks that technology across more than 50 years and four continents, which is the longest documented uptime record of any tertiary polishing option on the market. The same review notes HF CWs are sized at roughly 5 m² per population equivalent for municipal sewage (Section 2.2) and vertical-flow systems at 1–3 m²/PE (Section 2.3), giving the engineer defensible area numbers to validate any biological or tertiary stage in a tender response. For the broader equipment-selection logic that frames the rest of this article, see the industrial wastewater treatment equipment selection guide.
The 2026 Industrial Wastewater Treatment Technology Matrix
Five technology families cover roughly 90% of the credible 2026 industrial shortlist: DAF, MBR, A/O packaged plant, constructed wetlands, and industrial RO. The matrix below puts them side-by-side on the four columns a procurement manager actually screenshots — capacity, effluent quality, CAPEX band per m³/day, and best-fit influent. The numbers below are bracketed from the HydropureWater catalog and the S2 design review; treat them as 2026 order-of-magnitude bands, not point estimates.
| Technology | Footprint / Capacity | Typical Effluent (BOD / COD / TSS / NH₃-N) | CAPEX Band (USD per m³/day) | Best-Fit Influent |
|---|---|---|---|---|
| DAF (dissolved air flotation) | 4–300 m³/h; 13 standard models; compact skid | Removes >90% TSS, FOG, oil & grease, colloidal matter (pre-treatment only) | $80–$300 | High FOG / oil-laden streams: food, dairy, meat, petrochemical, pulp & paper, metalworking |
| MBR (membrane bioreactor) | 10–2,000 m³/day; 60% smaller footprint than CAS | <5 / <30 / <1 / <1 mg/L (typical design); <1 μm filtration | $400–$900 | Land-constrained sites with tight discharge or reuse targets |
| A/O packaged plant (WSZ series) | 1–80 m³/h; buried or trailer-mounted; no operator | ~20 / ~80 / ~20 / ~5–15 mg/L | $200–$500 | Small communities, hotels, hospitals, decentralized industrial sites |
| Constructed wetlands (HF / VF / hybrid) | HF ~5 m²/PE; VF 1–3 m²/PE; FWS sized on hydraulic retention | 30 mg/L BOD5 and 30 mg/L TSS (U.S. EPA HF target at 6 and 20 g/m²/d loading) | $50–$200 (earthworks and media dominated) | Land available; tertiary polishing; municipal-industrial hybrid sites |
| Industrial RO (polishing) | Recovery up to 95%; paired with UF pre-treatment | Conductivity reduction 95–99%; reuse-grade or ZLD concentrate | $300–$800 (excl. building) | Reuse, boiler feed, zero liquid discharge loops |
Read the matrix this way: the column that matters most to your plant is "best-fit influent." If your influent is FOG-dominated, DAF is non-negotiable at the head. If your influent is ammonia-regulated and you have land, hybrid VF+HF wetlands are the documented answer (S2, Section 2.4). Everything else in the table is a sizing exercise.
Pre-Treatment: Why DAF or Lamella Clarifiers Sit at the Front of Every Reliable Train
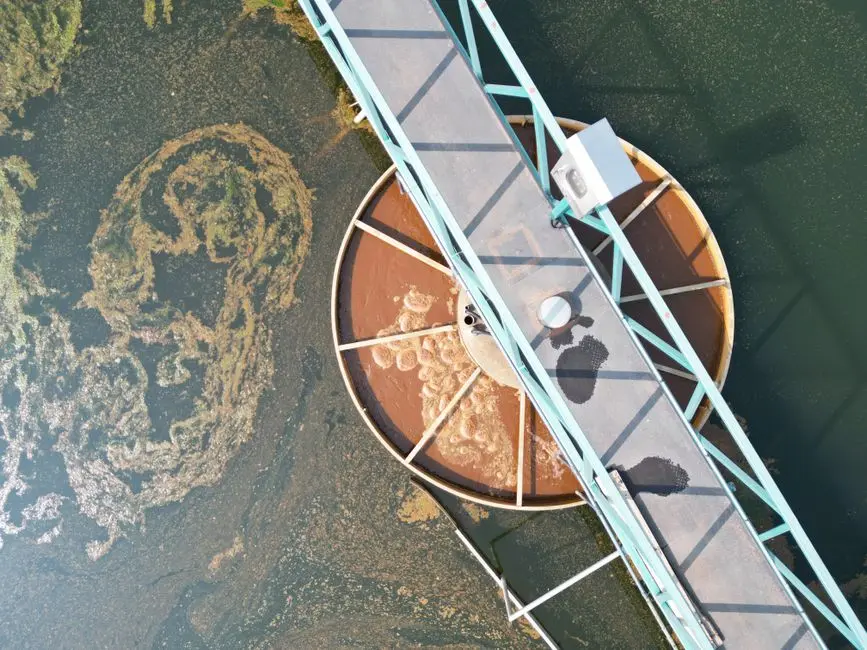
Every credible 2026 industrial train starts with a suspended-solids and FOG removal stage. The reason is mechanical, not regulatory: biological and membrane stages downstream will foul, plug, or wash out inside six months if colloidal solids, free oil, and grease pass through unchecked. The choice between a DAF system and a lamella clarifier is driven by one influent parameter: the FOG-to-TSS ratio.
DAF is the default when FOG, oil and grease, or colloidal matter dominate — common in food processing, dairy, meat rendering, edible-oil refining, pulp and paper, textile sizing, metalworking (cutting fluids), and refinery wastewater. The HydropureWater DAF line covers 4–300 m³/h across 13 standard models, uses micro-bubble saturation and a mechanical scraper for automatic skimming, and typically removes >90% of TSS and FOG in a single stage. For a sector-specific treatment of mining and metals influents, see this DAF vs clarifier for mining wastewater guide.
Lamella clarifiers are the alternative when FOG is low, TSS is high, and footprint must be minimal. Surface loading rates of 20–40 m/h and inclined-plate geometry deliver up to 30% lower chemical consumption than conventional clarifiers because the effective settling area is multiplied by the plate count. The practical rule for 2026 specifiers: DAF for FOG-laden streams, lamella for TSS-dominated streams with chemical-savings priority. Both produce a clarified stream ready for the biological stage.
Biological Treatment: MBR, A/O Packaged Plants, and Constructed Wetlands Compared
Three credible biological options exist for 2026 industrial tenders, and the choice between them is set by flow rate, footprint, and the discharge parameters on the permit. The parameter table below puts them on a level field, then the prose below explains where each one wins.
| Option | Flow Range | Footprint | Effluent Quality | Best When |
|---|---|---|---|---|
| MBR membrane bioreactor system | 10–2,000 m³/day | ~60% smaller than CAS | <1 μm filtrate; <5 mg/L BOD, <1 mg/L TSS typical | Tight discharge or reuse; land-constrained site |
| WSZ A/O packaged plant | 1–80 m³/h | Buried; minimal surface footprint | ~20 mg/L BOD, ~20 mg/L TSS, ~5–15 mg/L NH₃-N | Small communities, hotels, hospitals, decentralized industry |
| Constructed wetlands (HF / VF / hybrid) | Sized on m²/PE; HF ~5 m²/PE, VF 1–3 m²/PE | Land-intensive but lowest OPEX | 30 mg/L BOD5 and 30 mg/L TSS (U.S. EPA HF target) | Land available; tertiary polishing; ammonia-N / total-N regulated |
An MBR membrane bioreactor system combines activated sludge with submerged PVDF membranes at less than 1 μm cutoff. It produces the cleanest effluent of the three options, occupies about 60% of the footprint of conventional activated sludge, and is the only biological stage that lets the plant drop a downstream sand filter or clarifier. The tradeoff is lifecycle cost: membrane replacement and aeration energy dominate OPEX, so an MBR only pays back when the discharge limits are tight or the next step is reuse. For the operational realities, see the MBR effluent quality maintenance guide.
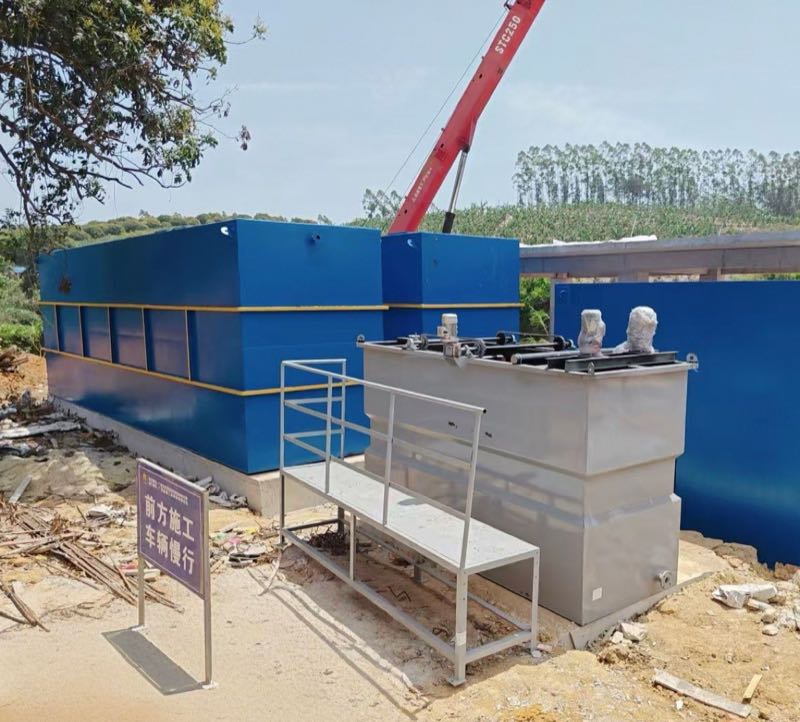
A WSZ A/O packaged plant packages anoxic/aerobic contact oxidation, sedimentation, and disinfection into a single buried or trailer-mounted unit sized 1–80 m³/h, fully automated with no on-site operator required. It is the right answer for decentralized industrial sites, small communities, hotels, and hospitals where civil works must be minimal and the discharge standard is conventional secondary.
Constructed wetlands are documented across 50+ years and four continents (S2). Three sub-types matter for a 2026 buyer: Free Water Surface (FWS), Horizontal Subsurface Flow (HF), and Vertical Subsurface Flow (VF). HF CWs use washed gravel of 10–20 mm grain size, target 30 mg/L BOD5 and 30 mg/L TSS at 6 and 20 g/m²/d inflow loads respectively, and run at roughly 5 m²/PE (S2, Section 2.2). They denitrify strongly but nitrify poorly because the bed stays waterlogged. VF CWs are intermittent pulse-dosed, occupy only 1–3 m²/PE, nitrify strongly, and offer no denitrification on their own (S2, Section 2.3). When ammonia-N and total-N are both regulated, the documented answer is a hybrid VF+HF configuration: VF for nitrification, HF for denitrification (S2, Section 2.4). A phosphorus warning worth quoting into the spec: FWS CWs only deliver low effluent P when inflow loading is held below 0.1 g P/m²/d, otherwise specify chemical precipitation upstream (S2, Section 2.1).
Polishing and Reuse: Where RO and Ultrafiltration Earn Their Place
Reverse osmosis and ultrafiltration are not biological treatment. They are polishing stages that sit downstream of MBR or tertiary-treated effluent when the plant objective shifts from "meet the discharge permit" to "produce reuse-grade or zero-liquid-discharge process water." An industrial RO system achieves recovery up to 95% and conductivity reduction of 95–99%, which makes it the right call for boiler feed, cooling-tower makeup, process reuse, or a ZLD loop in a water-stressed region. Without a reuse or ZLD driver, RO is over-specified and burns CAPEX without compliance benefit.
Ultrafiltration protects the RO membranes. An industrial UF system uses 0.03 μm PVDF hollow-fiber membranes at 2,000–40,000 L/h, removes bacteria, colloids, and suspended solids without chemicals, and accepts feed turbidity up to 300 ppm — keeping the RO feed Silt Density Index in the safe band. The decision rule for 2026 specifiers: reuse or ZLD target → add RO with UF pre-treatment after the biological stage; discharge-only → stop at the biological stage and skip the membrane polish.
A Decision Framework: Matching Your Influent to the Right Technology
The matrix above is reference; this section is the rule. Five branches, each triggered by one influent characteristic:
- High FOG or oil & grease present — lead with DAF, then proceed to MBR or A/O for the biological stage.
- High TSS, low FOG — lead with a lamella clarifier, then MBR or A/O. Save on coagulant versus a DAF on the same stream.
- Ammonia-N or total-N regulated AND land is available — specify hybrid VF+HF constructed wetlands as the tertiary stage (S2, Section 2.4). This is the lowest-OPEX biological option on the table and it has the longest documented uptime record.
- Land-constrained, tight discharge limits — specify MBR as the primary biological stage. It produces the cleanest effluent of any biological option and accepts the next stage being either a discharge outfall or a polishing RO train.
- Reuse or ZLD target — add RO with UF pre-treatment after the biological stage. The biological stage is sized to produce RO-feed-quality water; the RO/UF train is sized to the reuse demand.
For plant-specific configuration, the industrial wastewater treatment equipment selection guide walks the same decision tree with vendor-neutral equipment specs. The rule of thumb to remember: the technology family is set by the influent, not by the budget. The budget only sets the capacity.
2026 CAPEX and OPEX Reality Check
The matrix earlier gave CAPEX bands per m³/day; this section makes the OPEX side explicit, because in 2026 OPEX is where the lifecycle battle is won or lost. The table below is built from the same HydropureWater catalog capacity ranges used in the main matrix, paired with the S2 design parameters for constructed wetlands. Treat all values as 2026 USD order-of-magnitude bands, not turnkey quotes.
| Technology Family | CAPEX Driver | OPEX Driver | Lifecycle Tilt |
|---|---|---|---|
| DAF | Skid, saturator, scraper ($80–$300 per m³/day) | Polymer, compressed air, skimmer maintenance | OPEX modest; CAPEX dominated |
| MBR | Membrane cassettes, blower, fine screens ($400–$900 per m³/day) | Membrane replacement every 5–8 years, aeration energy, CIP chemicals | OPEX dominant — membrane swaps and aeration drive 60–70% of 20-year cost |
| WSZ A/O packaged plant | Buried tank, blowers, integral disinfection ($200–$500 per m³/day) | Low; minimal operator, standard aeration | Balanced; lowest of the buried biological options |
| Constructed wetlands (HF / VF / hybrid) | Earthworks, impermeable liner, washed gravel 10–20 mm (S2, Section 2.2), plants ($50–$200 per m³/day) | Lowest of any option — no blowers, no chemicals, no membrane swaps | OPEX near-zero after year 2; CAPEX dominates but is small |
| Industrial RO (+ UF pre-treatment) | High-pressure pumps, membrane vessels, energy recovery ($300–$800 per m³/day) | Energy, membrane replacement, concentrate disposal | OPEX dominant; only justified by reuse or ZLD revenue |
The honest 2026 reality: if your site has land, constructed wetlands are the lowest lifecycle-cost biological option on the table, and the S2 review gives you a 50-year evidence base to defend that choice to a procurement committee. If your site does not have land, MBR is the most defensible biological stage, but you must budget membrane replacement and aeration energy into OPEX, not paper it over. RO is a profit center only when there is a reuse or ZLD revenue line attached; otherwise it is a CAPEX line item waiting to be value-engineered out of the project.
Frequently Asked Questions
What is the documented effluent benchmark for a reliable constructed wetland?
The U.S. EPA horizontal-flow constructed-wetland design target is 30 mg/L BOD5 and 30 mg/L TSS, achieved at inflow loads of 6 g BOD₅/m²/d and 20 g TSS/m²/d respectively, with HF CWs sized at approximately 5 m² per population equivalent (Vymazal, Water, 2010-08, Section 2.2).
Should I specify DAF or a lamella clarifier at the head of my treatment train?
Specify DAF when influent FOG, oil and grease, or colloidal matter dominate — typical of food, dairy, petrochemical, and metalworking streams. Specify a lamella clarifier when FOG is low and TSS is high and chemical savings matter; surface loading of 20–40 m/h delivers up to 30% lower chemical consumption than a conventional clarifier. Either way, a biological stage (MBR or A/O packaged plant) follows the solids-removal step.
How do I achieve ammonia-N and total-N removal in a constructed-wetland-only train?
Use a hybrid VF+HF configuration. Vertical-flow wetlands nitrify but do not denitrify; horizontal-flow wetlands denitrify but nitrify poorly. Staging VF first and HF second is the documented combination for simultaneous ammonia-N and total-N removal, with VF CWs occupying only 1–3 m²/PE (Vymazal, Water, 2010-08, Sections 2.3 and 2.4).
What effluent quality can I expect from an MBR system, and how much space does it save?
An MBR membrane bioreactor typically delivers less than 1 μm filtrate with under 5 mg/L BOD and under 1 mg/L TSS in normal operation, and it occupies about 60% of the footprint of a conventional activated-sludge system for the same flow.
When does reverse osmosis make sense for an industrial wastewater plant?
Only when the plant has a reuse, boiler-feed, cooling-tower makeup, or zero-liquid-discharge objective. RO achieves recovery up to 95% and conductivity reduction of 95–99%, but it is energy-intensive and concentrate disposal is a real OPEX line. If the project only needs discharge compliance, RO is over-specified and burns CAPEX without compliance benefit.