
Why Textile Wastewater Treatment in India Is a 2026 Priority
Indian textile mills discharged roughly 425 million gallons of water per day in the WRI 2019 baseline, and the sector still contributes about 14% of the country's total industrial output while consuming 80% of the 130,000 tonnes of dyes produced in India each year (S4, 2022). The World Bank attributes 17–20% of all industrial wastewater to dyeing and finishing alone (S4, 2022). At the unit-process level, an average mill uses about 200 L of water per kg of fabric processed, and a single pair of jeans can carry 500 gallons (≈1,900 L) of embedded water in its supply chain (S4, 2022).
That footprint is now colliding with a tighter regulatory frame. CPCB Schedule VI caps for dye-based units, combined with state-level ZLD consents in Gujarat, Tamil Nadu, Maharashtra, and Karnataka, have pushed upgrades from optional to mandatory for any mill planning a 2026 expansion or consent renewal. A September 2026 Indian field study from Kuvempu University (Shivamogga, Karnataka) demonstrated that native-microbiome bioaugmentation on real alkaline textile effluent dropped COD to 194.3 mg/L, BOD to 13.5 mg/L, TDS to 998.3 mg/L, and decolorised 97.72% (Naik & Kousar, 2026, Current Microbiology 83:566). The study confirms that Indian research is still publishing viable, high-efficiency options an engineer can defend in a CPCB/SPCB hearing — and that the technology bar is rising every quarter.
Typical Textile Effluent Characteristics You Must Design For
Design numbers drive equipment sizing; vague ranges do not. Across the Indian and global mill population, real textile effluent typically falls in the bands below, with cotton-reactive dyehouses and polyester units at the upper end (S3, Int. J. Environ. Sci. Technol., 2018).
| Parameter | Typical range | Indian field / extreme example |
|---|---|---|
| pH | 8–11 | Strongly alkaline cotton-reactive dyehouse effluent (S3) |
| COD (mg/L) | 800–3,000 | Up to 3,000 in mixed cotton/polyester mills (S3) |
| BOD (mg/L) | 200–1,000 | 200–1,000 in cotton dyehouses (S3) |
| TDS (mg/L) | 2,000–8,000 | Driven by Glauber's salt and NaCl dosing (S3) |
| TSS (mg/L) | 200–1,000 | Spikes during desizing and printing washouts (S3) |
| Colour (Pt-Co) | 500–2,500 | 1,000–1,500 ADMI units reported (S3) |
| Temperature (°C) | 40–60 | Direct from dye-bath discharge (S3) |
| Dye concentration (mg/L) | 10–50 typical; 60 reactive cotton; 100–200 high; 600–800 very high; 7,000 extreme (S3) | Acid Orange 10 at 45 mg/L in an Indian final clarifier — Sivakumar 2014, in S3 |
| Heavy metals | Cr, Zn, Fe, Hg, Pb (S3) | Co, Cu, Cr also reported from dye chromophores (S3) |
Two design rules follow. First, watch the COD/BOD ratio: a ratio above 4–5 signals a large non-biodegradable dye load that will slip past a conventional biological stage (S3). Second, temperature must be trimmed to ≤ 40 °C before aeration tanks, or you will lose dissolved oxygen and crash nitrification kinetics. High alkalinity from caustic dosing also pushes equalisation-tank pH correction into the design basis rather than the optional column.
The 2026 Process Flow: How an Indian Textile ETP Is Actually Built
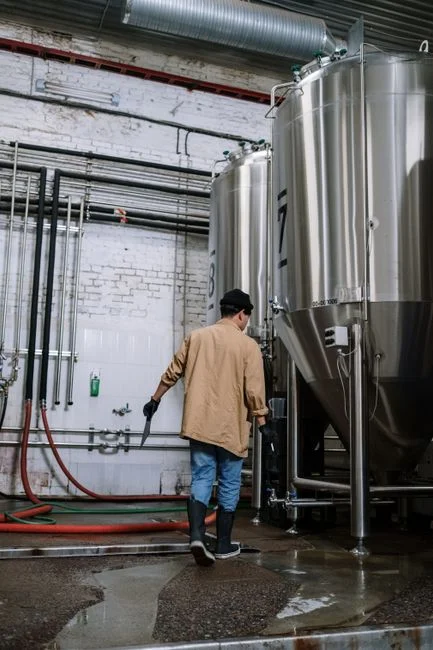
A 2026 Indian textile ETP runs in six stages, each addressing a specific pollutant class so the next stage can do its job. The chain is screening → equalisation → physico-chemical → biological → tertiary → ZLD/recycle.
- Headworks. A rotary bar screen at 5–10 mm aperture removes fabric lint, buttons, and packaging debris before a grit chamber protects downstream transfer pumps from abrasion.
- Equalisation and cooling. An 8–12 h HRT balance tank evens out pH, flow, and temperature. Online pH correction (typically HCl/H₂SO₄ or CO₂ trim) and a cooling loop (cooling tower or plate heat exchanger) bring mixed liquor to ≤ 40 °C before the biological stage.
- Physico-chemical. A dissolved air flotation unit with alum/polyacrylamide dosing, or a lamella clarifier, strips TSS, FOG, and colloidal dye. Dosing is handled by a PLC-controlled chemical dosing skid tied to flow and TSS meters.
- Biological. An integrated MBR plant with a submerged PVDF flat-sheet MBR module (0.1–0.4 μm pore) is now the default for new mills; SBR remains the retrofit workhorse; an upstream anaerobic UASB can cut COD by 50–70% before the aerobic polishing stage (see the UASB installation guide for design specifics).
- Tertiary polishing. Fenton oxidation (Fe²⁺/H₂O₂) attacks refractory colour and COD; ozone polishes residual organics without sludge; sand/AC filtration catches any carryover. The ozone oxidation guide for denim walks through the dose-rate math for indigo wash trains.
- ZLD or recycle. An industrial RO system operating at 65–75% recovery sends permeate to the dyeing house and brine to an MEE/ATFD evaporator; condensate is reused in washing. Combined stacks routinely lift overall removal to ~90% (S4, 2022).
MBR vs SBR vs Fenton vs Ozone: Which Technology Wins for Indian Textile Mills
The technology choice follows the constraint, not the brochure. The four-way comparison below maps each option to removal efficiency, footprint, and the operating realities an Indian engineer actually faces.
| Technology | COD removal | Colour removal | Footprint / CAPEX | OPEX profile | Best fit in 2026 |
|---|---|---|---|---|---|
| MBR (submerged PVDF) | 85–95% | > 90% (with coagulant) | ~60% smaller than CAS; higher membrane CAPEX | Power 0.4–0.8 kWh/m³; membrane replacement 3–5 yr | New mills, ZLD targets, RO reuse duty |
| SBR | 70–85% | 60–80% | Larger footprint; lower CAPEX | Lower power; higher sludge handling | Brownfield retrofits with intermittent flow |
| Fenton (Fe²⁺/H₂O₂) | 50–80% on refractory dyes | 80–95% | Compact reactors; chemical-heavy | Iron sludge, H₂O₂ cost, pH-sensitive | Polish step after biological on reactive dyes |
| Ozone (O₃) | 40–70% | > 95% at low dose | Generator + contactor; no sludge | High power (8–12 kWh/kg O₃) | Tight colour cap, residual organics post-MBR |
For a 2026 India decision framework: if the consent letter says ZLD, specify MBR + RO with an MEE/ATFD tail. If you are retrofitting a 15-year-old ETP with a tight capex envelope, run SBR + Fenton polish. If the audit risk is colour, add an ozone oxidation guide for denim-style polishing skid post-biological. The 2026 Shivamogga bioaugmentation study (Naik & Kousar, 2026) is a useful Indian reference: native-microbiome bioaugmentation alone hit 97.72% decolorisation, COD 194.3 mg/L, and BOD 13.5 mg/L on real alkaline effluent — proof that the biological stage can carry a much heavier load if you invest in the right consortium.
Meeting CPCB and SPCB Discharge Norms in 2026
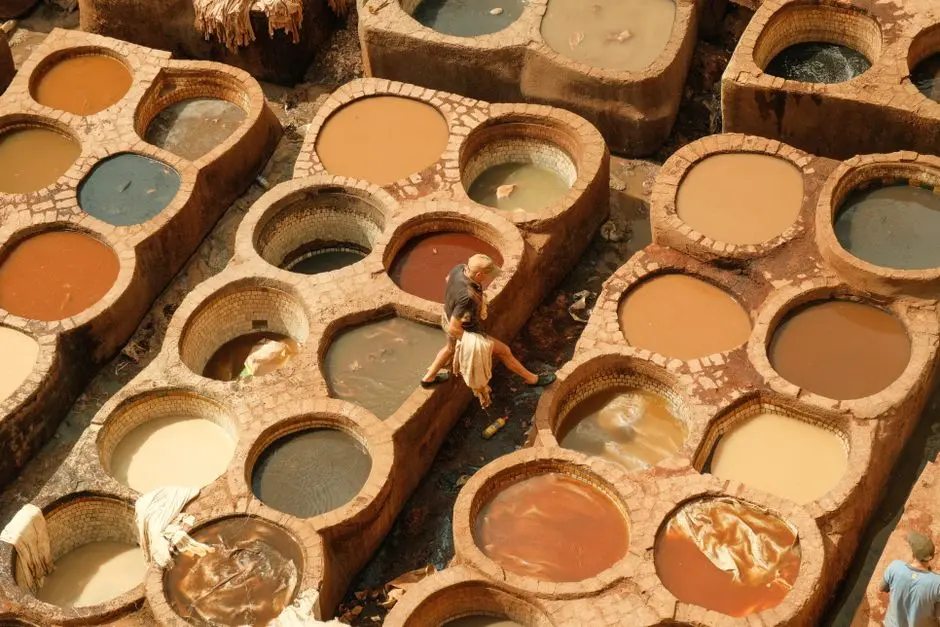
The numbers below are the ones SPCB auditors will check against your daily lab register. They are drawn from CPCB Schedule VI (dye-based units) and the typical consent conditions state PCBs now append for new or expanded textile projects.
- In-stream discharge limits: COD ≤ 250 mg/L, BOD ≤ 30 mg/L, TSS ≤ 100 mg/L, pH 6.5–8.5, colour ≤ 100 Pt-Co (CPCB Schedule VI, dye-based units).
- Heavy-metal ceilings: Cr(VI) ≤ 0.1 mg/L, total Cr ≤ 2 mg/L, Cu ≤ 3 mg/L, Zn ≤ 5 mg/L, Pb ≤ 0.1 mg/L.
- TDS: state-specific. Gujarat, Rajasthan, and parts of Tamil Nadu now require TDS ≤ 2,100 mg/L on in-stream discharge, which is the regulatory hook that forces RO into the flow.
- ZLD consent: many new textile CETPs and expansions are consented to ZERO LIQUID DISCHARGE under state PCB conditions — the ETP-to-ZLD gap (biological effluent still too high in TDS for direct reuse) is the most common audit trigger in 2026.
- Detoxification evidence: the Shivamogga bioaugmentation study (Naik & Kousar, 2026) lifted rice-seed (Oryza sativa) germination from 0% in raw effluent to 73.33–93.33% after treatment — useful documented evidence if an SPCB asks for ecotoxicity data, not just chemistry.
Map your unit operations to the limit you are at risk of breaching. If your colour column is borderline, ozone or Fenton polish closes the gap. If TDS is the audit trigger, the only answer is RO plus evaporator — biological alone will not move it.
2026 Cost of a Textile ETP in India: CAPEX and OPEX Bands
Procurement and finance will ask one question first: what does it cost? The bands below are 2026 India ranges per 100 m³/day of installed capacity, drawn from recent turnkey project experience across Tirupur, Ludhiana, and Surat textile clusters (HydropureWater field data, 2026). They exclude land and CETP membership fees.
| Configuration | CAPEX (₹ / 100 m³/day) | Power OPEX (₹/m³) | Chemical OPEX (₹/m³) | Membrane replacement |
|---|---|---|---|---|
| Biological-only (SBR/CAS) | 35–70 lakh | 6–10 | 3–5 | Not applicable |
| MBR-based ETP | 1.2–1.8 crore | 10–18 | 4–7 | UF modules 3–5 yr |
| Full ZLD (RO + MEE/ATFD) | 2.5–4.0 crore | 25–40 | 5–8 | UF 3–5 yr, RO 3–5 yr |
Three cost levers decide the final number. First, an MBR + RO train typically halves the volume sent to thermal evaporators, cutting MEE OPEX by 40–60%. Second, pumping and aeration are the two largest power draws — a high-efficiency blower and a submerged PVDF flat-sheet MBR module directly lower the OPEX line. Third, RO permeate reused in dyeing at 60–70% recovery offsets fresh-water purchase in water-stressed districts (Tirupur, Pali, Erode), which materially changes the project IRR. Sludge dewatering with a plate-and-frame filter press cuts sludge volume 70–80% versus a drying bed, and the cake is typically dispatched to a cement kiln or TSDF. The sludge thickener energy guide covers the upstream energy numbers. For context on how India's regulatory model compares with mature European reuse frameworks, the Prato-style textile reuse rules walk through the Italian district model.
Frequently Asked Questions
What is the standard 2026 CPCB discharge limit for a textile ETP in India?
CPCB Schedule VI for dye-based units caps COD at ≤ 250 mg/L, BOD ≤ 30 mg/L, TSS ≤ 100 mg/L, pH 6.5–8.5, and colour ≤ 100 Pt-Co for in-stream discharge. State PCBs in Gujarat, Tamil Nadu, Maharashtra, and Karnataka layer TDS ≤ 2,100 mg/L and ZLD consent conditions on top.
How much does a 500 m³/day textile ETP cost in India in 2026?
A 500 m³/day MBR-based textile ETP sits at roughly ₹6–9 crore CAPEX in 2026, with OPEX around ₹10–18 per m³ for power and ₹4–7 per m³ for chemicals (HydropureWater field data, 2026). A full ZLD scope with RO and an MEE/ATFD evaporator pushes CAPEX to ₹12–20 crore and OPEX to ₹25–40 per m³.
Which technology gives the best colour removal for an Indian textile ETP?
Ozone delivers > 95% colour removal at low dose on refractory dyes with no sludge, but it is power-hungry. The 2026 Shivamogga bioaugmentation study (Naik & Kousar, 2026) reported 97.72% decolorisation using native-microbiome-aided bioaugmentation on real alkaline effluent, while a hybrid MBR + Fenton or MBR + ozone polish train is the most defensible 2026 configuration for an Indian mill.