The Three-Layer Regulatory Stack for Leesburg-Area F&B Plants
Food and beverage plants near Leesburg, Florida meet pretreatment limits by stacking three regulatory layers — the EPA National Pretreatment Program at 40 CFR 403, industry-specific categorical standards in 40 CFR Parts 405–409, and site-specific local POTW permits issued by the Leesburg or delegated control authority — and then running wastewater through a six-stage train: screening, equalization, dissolved air flotation (DAF), biological treatment (activated sludge or MBR), chemical phosphorus precipitation, and final polishing, with continuous pH and flow monitoring plus electronic DMR submission in 2026.
The first layer is the EPA National Pretreatment Program, codified at 40 CFR Part 403, which sets the federal framework and is administered locally by POTWs acting as control authorities with delegated enforcement power (per EPA, 40 CFR 403). The second layer is the F&B-specific categorical standards: 40 CFR Part 405 (Dairy Products), Part 406 (Grain Mills), Part 407 (Canned and Preserved Fruits and Vegetables), Part 408 (Canned and Preserved Seafood), and Part 409 (Meat Products). These subparts set the numerical floors for BOD, TSS, FOG, and pH on a process-by-process basis. Plants with co-located rendering or hide-processing also need to review 40 CFR Part 410 (Tanning), which sits adjacent to F&B and applies to co-located hide work. The third layer is the site-specific POTW discharge permit — the City of Leesburg wastewater facility and any neighboring Lake County / East Lake / Harris POTW may set local limits stricter than the federal floor, especially where the receiving plant has limited hydraulic capacity or sensitive biosolids handling (per Lake County utilities' industrial user rules, 2026).
Florida DEP (FDEP) is the state oversight agency and emphasizes nutrient removal because of sensitive ecosystems like the Everglades (per FDEP industrial wastewater program guidance, 2026). For Leesburg-area plants, that means total phosphorus and ammonia limits at the POTW headworks are a real exposure, not a theoretical one. The bottom line: federal categorical limits are the floor, FDEP and local permit conditions are the enforceable ceiling, and engineering design has to hit both — a useful primer for the national frame is the national 40 CFR 403 + categorical-standards explainer.
The Six Parameters That Govern Every F&B Pretreatment Design
BOD/COD, TSS, FOG, total phosphorus, pH, and temperature are the six parameters that show up in virtually every F&B categorical permit and every local Leesburg/POTW limit. Raw dairy and meat wastewater runs 1,000–10,000 mg/L BOD against a typical POTW local limit of 250–500 mg/L — categorical subpart limits sit in the same order of magnitude but vary by process stream (per 40 CFR 405–409). TSS in well-screened streams commonly lands near 100 mg/L but rises sharply with pulp, grain, and rendering carryover. FOG from fryer, rendering, and stickwater streams reaches several thousand mg/L; categorical permits typically cap effluent O&G at 25–50 mg/L (per 40 CFR 405–409 limits).
Total phosphorus in cereal, dairy, and meat wastewaters commonly falls between 10 and 100 mg/L as P, against a roughly 1 mg/L ceiling that most POTWs apply at their headworks in 2026 (per Lake County/EPA nutrient guidance, 2026). pH carries a categorical floor of 6.0–9.0, and CIP dumps and acid/alkaline cleaners are the usual cause of excursions (per 40 CFR 403 general standards). Temperature is the parameter engineers forget: CIP and cooking operations routinely push wastewater above 40 °C, which can shut down downstream nitrification biology if not equalized (per HydropureWater field data, 2026).
This parameter set matters more in 2026 than it did five years ago because more organic mass is reaching municipal sewers. A 2024 Nature Food analysis concluded that US food loss and waste policy alone cannot meet the federal target of 74 kg per capita by 2030, with state-level diversion potential of only 5–14 kg per capita and continued rising generation in most states (Springer / Nature Food, 2024). Translated to the Leesburg-area POTW: control authorities are scrutinizing high-strength F&B discharges more closely, and design basis older than two years should be considered stale.
| Parameter | Raw F&B Range | Typical POTW / Categorical Limit | Treatment Stage That Targets It |
|---|---|---|---|
| BOD/COD | 1,000–10,000 mg/L (dairy, meat) | 250–500 mg/L BOD (local limit varies) | Biological (activated sludge or MBR) |
| TSS | ~100 mg/L typical; higher with pulp/grain | 25–50 mg/L achievable | DAF + biological + clarifier |
| FOG (O&G) | Several thousand mg/L (fryer, rendering) | 25–50 mg/L O&G | DAF with coagulant conditioning |
| Total phosphorus | 10–100 mg/L as P | ~1 mg/L at headworks | Biological luxury uptake + chemical precipitation |
| pH | 5.0–11.0 excursions (CIP) | 6.0–9.0 (categorical floor) | Equalization + trim dosing |
| Temperature | 40–60 °C during CIP | <40 °C for stable nitrification | Equalization basin / cooling loop |
The 2026 F&B Pretreatment Train, Stage by Stage
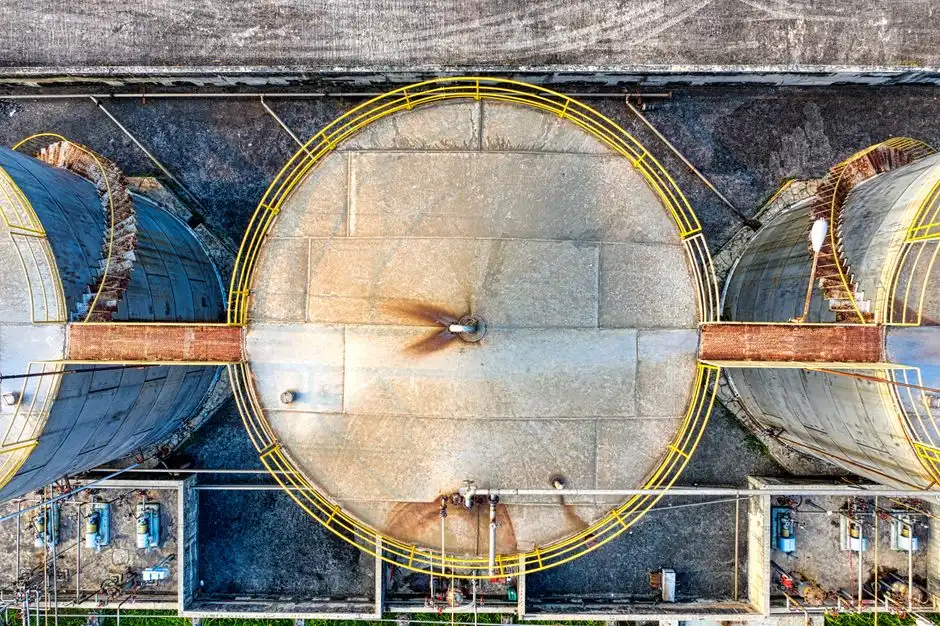
The defensible 2026 F&B pretreatment train runs screening, equalization, DAF, biological treatment, chemical precipitation, and final polishing in that order. Each stage is justified by a specific pollutant and a measurable performance band, so the engineer can defend the basis-of-design to a delegated POTW reviewer in Lake County.
Stage 1 — Screening. A rotary mechanical bar screen removes rags, plastics, and fibrous debris before they reach pumps or biological reactors. The GX-series rotary mechanical bar screen is sized for F&B rag loads and protects downstream equipment.
Stage 2 — Equalization basin. Six to twenty-four hours of hydraulic retention time absorbs CIP and batch-process peaks, preventing pH and temperature excursions from reaching biology. This is the single most common undersized unit in F&B plants — a 4-hour CIP cycle on a 6-hour HRT basin is the typical root cause of pH and FOG excursions at the POTW headworks (per HydropureWater field data, 2026).
Stage 3 — Dissolved air flotation (DAF). Micro-bubble flotation with coagulant conditioning targets FOG and bulk TSS. Sizing inputs are surface loading rate 4–25 m/h, air-to-solids ratio 0.005–0.02, and recycle rate 20–40% of forward flow. A 3,000 mg/L FOG dairy stream sits at the conservative end; a 10,000+ mg/L FOG meat-rendering stream pushes toward the higher recycle rate and longer retention model. The dissolved air flotation (DAF) system with proper coagulant conditioning typically achieves 25–50 mg/L O&G in the underflow and 50–100 mg/L TSS across that hydraulic envelope.
Stage 4 — Biological treatment. Activated sludge runs 8–24 h HRT with MLSS at 3,000–5,000 mg/L; MBR runs 4–10 h HRT with MLSS at 8,000–12,000 mg/L. DO setpoint is 1.5–2.5 mg/L where nitrification is required. An integrated MBR membrane bioreactor typically delivers under 30 mg/L BOD and under 5 mg/L TSS in the effluent (per HydropureWater field data, 2026).
Stage 5 — Chemical phosphorus precipitation. Fifty to 250 mg/L of alum or 30–150 mg/L of ferric chloride is the typical F&B dose band, depending on the form of P and the mixed-liquor alkalinity. A PLC-controlled chemical dosing skid cuts chemical consumption 10–20% versus manual feed by trimming to flow-proportional load. Biological luxury uptake removes 5–15 mg/L of P, and the downstream chemical stage polishes TP to 0.5–1 mg/L before discharge.
Stage 6 — Final polishing and disinfection. For older plants on weaker permits, a lamella clarifier or high-efficiency sedimentation tank at 20–40 m/h surface loading delivers a polish step without expanding the footprint. Where required, a ClO₂ generator holds a 0.1–0.5 mg/L residual before the sewer. Sludge side-stream: DAF skimmings plus biological WAS are dewatered on a plate and frame filter press in the 1–500 m² range, reaching 22–28% dry solids — small enough to landfill or send to a digester.
The 2026 Compliance Stack: SCADA, eDMR, and Electronic Noncompliance Reporting
Most F&B categorical permits require 24-hour composite sampling for BOD, TSS, FOG, and TP at frequencies from monthly to quarterly, with continuous monitoring of pH and flow for significant industrial users (per 40 CFR 403.12 reporting rules). The 2026 practical compliance stack is the SCADA event log, the eDMR (electronic Discharge Monitoring Report) submission, and the state noncompliance portal. FDEP and delegated POTWs now default to electronic reporting for any significant industrial user — a passing sample is not enough; an unreported excursion on a Saturday CIP drain carries the same enforcement weight as a chronic violation (per FDEP electronic reporting guidance, 2026).
Common rejection reasons at the POTW headworks map directly to process train weaknesses and become a forcing function for equipment selection. FOG pass-through points to under-dosed DAF coagulant or hydraulic overload on the flotation cell. pH excursions point to inadequate equalization or a failed trim loop. Hydraulic overload during a 4-hour CIP cycle points to an undersized EQ basin. Solids breakthrough on the TP limit points to poor flocculation control in chemical precipitation. A useful cross-check for adjacent waste streams is the coagulant dosing equipment selection guide, which maps dose ranges to the upstream pollutant profile.
Leesburg-Area Action Checklist Before You Discharge
Four items to action this week, in the order an FDEP or POTW reviewer will expect to see them.
- Confirm which POTW you discharge to — City of Leesburg wastewater facility or a neighboring Lake County utility (East Lake, Harris) — and pull the current permit's local limits, not just the federal categorical floor (per City of Leesburg utilities, 2026).
- Run a one-week composite characterization for BOD, TSS, FOG, TP, pH, and temperature. A design basis older than two years should be considered stale and revalidated (per HydropureWater field data, 2026).
- Verify that SCADA can export compliant event data to both the POTW and FDEP portals in 2026 — manual logs are no longer a defensible compliance posture for a significant industrial user.
- Document the treatment train against 40 CFR 405–409 subpart for the plant's NAICS code so the local authority sees the categorical basis, not a vendor cut sheet. For border-region context, the Mexico-US border F&B pretreatment compliance guide walks the same regulatory frame for Texas-adjacent plants.
Frequently Asked Questions
Which federal rules apply to a Leesburg-area F&B plant discharging to a POTW?
The National Pretreatment Program at 40 CFR 403 sets the federal framework, with industry-specific numerical floors in 40 CFR 405 (Dairy), 406 (Grain Mills), 407 (Canned Fruits/Vegetables), 408 (Canned Seafood), and 409 (Meat Products) — local POTW permits are often stricter than these categorical floors.
What does a properly designed DAF deliver on FOG in a dairy or meat stream?
A DAF with proper coagulant conditioning typically achieves 25–50 mg/L O&G in the underflow and 50–100 mg/L TSS, across hydraulic loadings of 4–25 m/h (per HydropureWater field data, 2026).
How is total phosphorus reliably taken from 10–100 mg/L down to a ~1 mg/L ceiling?
Biological luxury uptake by biomass removes 5–15 mg/L of P, and a downstream chemical precipitation stage dosing 50–250 mg/L of alum (or 30–150 mg/L of ferric chloride) polishes TP to 0.5–1 mg/L before discharge (per HydropureWater field data, 2026).
Is electronic reporting mandatory for F&B significant industrial users in 2026?
Yes. FDEP and most delegated POTWs now default to electronic reporting for any significant industrial user; plant SCADA should be configured to push event data automatically into the eDMR and state noncompliance portals rather than relying on manual logs (per FDEP electronic reporting guidance, 2026).