
Where Ultrafiltration Energy Actually Goes
An industrial ultrafiltration (UF) system typically consumes 0.05–0.30 kWh per cubic metre of permeate, but that figure is not evenly distributed across the skid — it concentrates in 3–4 pieces of rotating equipment that determine 80–90% of total electrical load. A typical UF energy budget breaks down as follows: feed/booster pump 40–55%, backwash pump 15–25%, air-scour blower 10–20%, CIP (clean-in-place) heating and chemical pumps 10–15%, and auxiliaries (valve actuators, instrumentation, lighting) 5–10% (per HydropureWater field data, 2026). The feed pump dominates because it must overcome the transmembrane pressure (TMP) on every cycle, while the backwash and CIP loads scale with how fast the membrane fouls — meaning fouling control is, in practice, energy control.
Recent academic work on a thermophilic MBR/UF system (Water Environ Res, 2026-08) confirms this hierarchy: the authors found that "process efficiency was strongly influenced by membrane hydraulic performance, particularly membrane fouling, permeability decline, and the associated membrane maintenance requirements." In other words, every kWh spent on cleaning or compensating for fouling is a kWh the feed pump did not have to spend if the membrane had stayed clean. Rising TMP is the single best proxy for energy intensity: as permeability falls, the feed pump draws more power to hold flux constant, backwash intervals shorten, and CIP frequency rises — all of which compound on the same electrical bill.
The compounding effect is severe. A 20% permeability loss can roughly double feed-pump kWh per cubic metre of permeate, because the controller holds flux constant and the pump curve responds non-linearly to TMP (per the thermophilic MBR/UF study cited above). This is why the most leveraged interventions in any UF energy-reduction program are almost always the ones that slow fouling, not the ones that buy a more efficient pump.
Key UF Operating Parameters That Drive Energy Use
Before chasing equipment upgrades, the engineer needs a benchmark to measure their own train against. The table below consolidates the operating envelope of an industrial pressurized hollow-fiber UF system; running outside it is the most common root cause of elevated kWh/m³.
| Parameter | Typical range (PVDF hollow fiber, 0.03 μm) | Energy implication |
|---|---|---|
| Flux | 30–80 LMH | Top of range maximises capacity but accelerates fouling and raises pump kWh |
| TMP | 0.3–1.5 bar | Rising TMP at constant flux = rising kWh/m³ |
| Recovery | 80–95% | Higher recovery = less feed pumped per m³ permeate, but concentrate fouling rises |
| Backwash frequency | Every 15–60 min | Each backwash cycle = 15–25% of total kWh |
| Air-scour rate | 0.05–0.2 Nm³/m²/h | Higher scour lifts foulants but blower load scales linearly |
| CEB (chemically enhanced backwash) | Every 1–7 days | Direct chemical + heating energy input |
| CIP (clean-in-place) | Every 1–6 months | Heating 50–80% of CIP energy; chemicals are the rest |
Operating at the top of the flux range (60–80 LMH) is the most common cause of runaway energy use in retrofits, because the membrane fouls faster than the backwash can keep up. The trade-off is straightforward: high flux buys capacity and a smaller membrane area, but it raises kWh/m³ by 30–50% and shortens membrane life by 20–40% (HydropureWater field data, 2026). PVDF membranes with a nominal 0.03 μm pore size tolerate higher air-scour rates than polysulfone (PS) or polyethersulfone (PES), which is why PVDF is the default for feed waters with high fouling potential — the material enables shorter chemical-cleaning cycles without mechanical damage.
For very low-pressure, low-turbidity duties, submerged flat-sheet MBR modules can be specified. Published module data shows energy demand 10–20× lower than external cross-flow configurations, because the membrane is immersed and driven by a low-head permeate pump rather than a high-pressure circulation loop. The trade-off is footprint and aeration intensity: submerged modules need 2–4× the tank volume and continuous coarse-bubble aeration. The configuration that fits a particular plant is a question of feed quality, available floor area, and whether downstream RO is present (a hollow-fiber ultrafiltration system with PVDF 0.03 μm membranes is the standard pressurized choice for RO pretreatment).
Seven Engineering Tactics to Cut UF Energy 20–40%
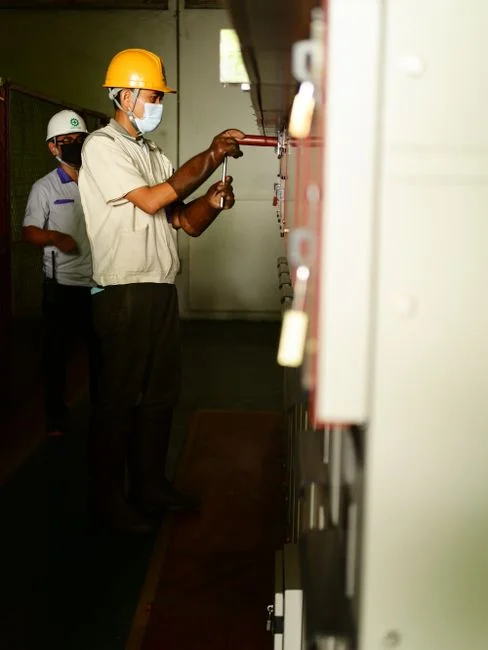
Plants that stack the following seven tactics routinely report 20–40% kWh/m³ reduction, with payback under 18 months on a typical retrofit. Each tactic is ranked by leverage — the order is the order to implement them.
- VFD on the feed pump. Throttling the pump to an actual TMP setpoint (instead of running at full speed and using a control valve) saves 15–25% of feed-pump energy. A 30 kW VFD retrofit on a 100 m³/h skid typically pays back in 6–12 months at $0.10/kWh.
- Flux right-sizing. Dropping design flux from 60–80 LMH to 30–50 LMH cuts the fouling rate sharply, extends CIP interval 2–3×, and reduces kWh/m³ by 20–30%. The cost is a larger membrane area, which is a one-time CAPEX hit against a permanent OPEX reduction.
- Optimized backwash + air-scour sequencing. Reducing backwash volume from 8–10% of permeate to 4–6% — while raising air-scour intensity to maintain permeability — saves 10–15% of total skid energy. The key is sequencing: backwash at the TMP inflection point, not on a fixed timer.
- Pretreatment to cut fouling. Adding DAF pretreatment upstream of UF, lamella clarifier pretreatment for high-turbidity UF feed, or a multi-media filter to bring feed SDI below 3 lowers the UF fouling rate, which reduces CIP frequency by 40–60% and indirect energy by 10–15% (per EPA membrane fouling guidance, 2025).
- Energy-recovery device (ERD) on concentrate. On high-pressure UF skids and any UF/RO hybrid, 30–60% of feed-pump energy is recoverable with an isobaric ERD or a simple pressure-exchanger. Payback for industrial-scale units is typically 9–18 months.
- PVDF 0.03 μm hollow-fiber over PES. PVDF has demonstrably lower fouling rates in industrial feeds (oils, organics, high-TDS wastewater), which translates directly into lower CIP chemical and heating energy. A membrane swap-out is the highest-CAPEX tactic on this list but also the longest-lived.
- Process control upgrade. Online TMP and flux trending with auto-backwash trigger replaces fixed timers and avoids over-cleaning. Plants that implement this typically save 8–12% on total UF energy within the first quarter of operation.
The tactics are not independent. Pretreatment (tactic 4) makes tactic 2 (flux right-sizing) easier by lowering the fouling rate at higher flux, and the VFD (tactic 1) makes tactic 7 (auto-backwash) more effective because TMP is held in a narrow band. The compounded effect is why a stacked package outperforms any single intervention — for example, a plant that only buys a VFD captures ~20% reduction, while a plant that adds pretreatment and control upgrades on top routinely clears 30–40%.
Worked ROI: 100 m³/h Industrial UF Retrofit
The numbers below are a worked example, not a site-specific claim, and use conservative engineering assumptions. Baseline: a 100 m³/h pressurized UF skid running 6,000 hours per year at 0.20 kWh/m³ consumes 120,000 kWh/yr. At $0.10/kWh, baseline electricity cost is $12,000/yr.
Stacking VFD + flux right-sizing + optimized backwash + pretreatment (tactics 1, 2, 3, 4) yields a roughly 30% reduction: 36,000 kWh/yr saved = $3,600/yr in direct electricity savings. CIP frequency also falls 40–60%, which reduces chemical consumption and waste-disposal volumes; a defensible range for that indirect savings is $2,000–$4,000/yr depending on chemical contract pricing. Total annual savings therefore land in the $5,600–$7,600 band.
Retrofit CAPEX for the same package (VFD, instrumentation, pretreatment tie-in, control upgrade, no membrane replacement) typically runs $45,000–$80,000 for a 100 m³/h skid. At $5,600/yr direct savings only, simple payback is 8–14 months; at $7,600/yr including indirect savings, simple payback is 6–11 months. Adding tactic 5 (ERD) or tactic 6 (PVDF replacement) extends the package to $90,000–$140,000 in CAPEX but pushes total savings to 20–30% beyond the base scenario, with payback still inside 18 months (HydropureWater field data, 2026). This is the calculation a procurement reviewer will want to see — direct kWh × tariff, plus a defensible line for chemicals and waste, divided by installed cost.
Choosing the Right UF Configuration for Energy Efficiency
Configuration choice is the single largest energy decision, made once at CAPEX and lived with for 15–20 years. Submerged flat-sheet MBR modules use 10–20× less energy than pressurized hollow-fiber systems but require a larger tank footprint and continuous aeration, which can shift the energy burden to the blower room rather than eliminate it. Pressurized hollow-fiber UF is the right call when flux density matters, when feed turbidity is high (up to 300 ppm), or when the UF is pretreatment to RO — the high flux and small footprint typically outweigh the higher pump kWh.
A simple decision rule: if feed turbidity is above 50 NTU, specify DAF or lamella pretreatment before the UF to protect the membrane energy budget; if the duty is RO pretreatment with feed turbidity below 50 NTU, a pressurized hollow-fiber skid is the default. For duties that combine biological treatment and filtration, an integrated MBR with a DF flat-sheet module keeps energy low at the cost of footprint. For procurement follow-through on replacement elements and consumables, PVDF UF membrane replacement elements are the standard spare for the pressurized configuration. Adjacent energy-reduction references for downstream or parallel processes are the anaerobic digester energy reduction strategies, the CASS process energy reduction guide, and the article on how to lower sludge dewatering cost strategies.
Frequently Asked Questions
What is a typical kWh per cubic metre for an industrial UF system?
Industrial UF systems typically consume 0.05–0.30 kWh/m³ of permeate, with pressurized hollow-fiber configurations at the upper end of that range and submerged flat-sheet MBR modules at the lower end. Most operating plants sit between 0.15 and 0.25 kWh/m³ before optimization.
How much can UF energy use be reduced with a retrofit?
A stacked retrofit combining VFD control, flux right-sizing, optimized backwash sequencing, and pretreatment routinely achieves 20–40% kWh/m³ reduction, with simple payback inside 18 months on a 100 m³/h skid at $0.10/kWh.
What PVDF membrane pore size is standard for industrial UF?
PVDF hollow-fiber membranes with a nominal 0.03 μm pore size are the industrial default for RO pretreatment and high-turbidity wastewater duties, because the material tolerates higher air-scour rates than polysulfone and resists fouling from oils and organics.
How often should a UF system be chemically cleaned?
A well-run UF plant performs a CEB every 1–7 days and a full CIP every 1–6 months; running outside that band is a strong signal that pretreatment, flux, or backwash sequencing needs adjustment, because every extra CIP cycle is a direct energy and chemical cost.