Why Petroleum Wastewater Changes the MBR vs CAS Decision
Refinery, terminal, and oilfield-produced water in the Prosser area arrives at the biological step with 50–500+ mg/L oil & grease (free plus emulsified), 5–50 mg/L BTEX, 10–200 mg/L phenols, sulfides, and temperatures of 30–45 °C that swing ±10 °C across batch turnarounds. Salinity climbs when produced water is co-mingled with refinery desalter brine, often pushing conductivity above 5,000 µS/cm. These parameters differ from standard municipal wastewater, requiring technology choices based on petroleum-specific conditions.
Conventional activated sludge settles solids in a secondary clarifier under gravity. Oil-coated biomass loses the density differential that drives floc aggregation, and a single slug of emulsified oil can push the sludge volume index above 250 mL/g in 24–48 hours. Membrane bioreactors (MBR) replace the clarifier with submerged MF/UF membranes in the 0.04–0.2 μm range, which retain nearly all bacteria and viruses regardless of how poorly the biomass is settling (Grasmick thesis, Université de Montpellier, 2012). The plant-wide model by Mannina et al. (2019) shows that refinery influent characteristics—high rbCOD, low C/N—shift MBR GHG emissions and N2O production compared with the municipal scenarios that dominate the published CAS vs MBR literature.
That change in solid-liquid separation physics makes the MBR case fundamentally different at a Prosser petroleum site than at a 50 MGD municipal plant. Everything downstream—footprint, SRT, effluent TSS, reuse viability, and OPEX risk—flows from this technical distinction.
Treatment Train Comparison: CAS vs MBR for Refinery Effluent
A typical CAS train for petroleum duty consists of an oil/water separator, a corrugated plate interceptor (CPI) or DAF, equalization, a primary clarifier, an aeration basin, a secondary clarifier, and a multimedia filter or UV/chlorine system. The MBR train collapses two of those steps: oil/water separator → dissolved air flotation unit → equalization → fine screen (≤2 mm) → anoxic/aerobic bioreactor with submerged membrane cassette → UV or chlorine. There is no separate secondary clarifier, and the polishing filter is usually redundant because the membrane already delivers <1 NTU turbidity.
CAS depends on floc aggregation to settle solids, whereas MBR uses a physical membrane barrier (Judd, 2010; Ma et al., 2018, both cited in Mannina et al., 2019). An oil event that destroys floc in a CAS basin does not stop an MBR from producing clean permeate, as the membrane functions regardless of settling properties. MBR also runs at 30–60+ day SRT versus the 5–15 day SRT typical of a CAS basin; this longer SRT improves the degradation of phenols, PAHs, and other complex petroleum hydrocarbons.
The pre-treatment gate is the same for both trains and remains the most common reason petroleum MBRs fail in the field. Oil & grease above roughly 50 mg/L disrupts CAS settling, while levels above 100 mg/L risk irreversible membrane fouling. DAF is the standard pre-step in petroleum duty, with hydraulic loading rates of 5–25 m/h and oil removal typically exceeding 90% on a well-designed unit. Biological systems require DAF treatment regardless of whether the final process is CAS or MBR.
| Parameter | CAS Train | MBR Train |
|---|---|---|
| Solid/liquid separation | Gravity clarifier (floc settling) | Submerged MF/UF membrane (0.04–0.2 μm) |
| Typical SRT (days) | 5–15 | 30–60+ |
| Pre-treatment required | Oil/water sep + CPI or DAF | Oil/water sep + DAF + ≤2 mm screen |
| Oil & grease tolerance at biology | <50 mg/L before settling fails | <100 mg/L before fouling risk |
| Effluent polishing step | Multimedia filter + UV | UV only (membrane = polish) |
| Sludge yield | Higher (low SRT) | Lower (high SRT, low Y) |
Effluent Quality, Footprint, and Reuse Potential in Prosser

An MBR running submerged flat-sheet membranes at <1 μm nominal pore size delivers TSS consistently below 5 mg/L and turbidity below 1 NTU. These values meet most cooling-tower make-up and many boiler-feed pre-RO specifications without further treatment. A well-operated CAS clarifier with a polishing filter typically lands at 10–30 mg/L TSS, which is often insufficient for refinery recycle loops. For a Prosser-area facility planning internal reuse during the irrigation season, the MBR's stable sub-5 mg/L TSS often eliminates the need for fresh water.
Footprint is the second significant differentiator. The integrated MBR skid from HydropureWater is roughly 60% smaller than a comparable conventional system, providing a decisive advantage on a tight refinery plot near the Yakima River where space is at a premium. Flat-sheet modules also use 10–20× less energy than external cross-flow MBR configurations because permeate is pulled by gentle vacuum rather than recirculated at high pressure; the DF-series flat-sheet membrane cassette implements this advantage.
The operating risks differ in nature. MBR's primary failure mode is membrane fouling, managed by chemical clean-in-place (CIP) every 6–12 months and by maintaining critical flux below 15–20 LMH for refinery feeds. CAS's failure mode is sludge bulking and washout, which a petroleum slug can trigger within a day. For a 2026 NPDES application, MBR's stable, low-effluent TSS provides a more robust permit defense.
| Parameter | CAS (well-operated) | MBR (flat-sheet) |
|---|---|---|
| Effluent TSS | 10–30 mg/L | <5 mg/L |
| Effluent turbidity | 5–15 NTU | <1 NTU |
| Footprint | Baseline (100%) | ~40% of CAS (60% smaller) |
| Reuse suitability (cooling/boiler pre-RO) | Marginal, needs polishing | Direct |
| CIP / clean frequency | N/A (clarifier) | Every 6–12 months |
| Primary failure mode | Bulking, washout | Membrane fouling |
CAPEX, OPEX, and Permit Fit in Washington State
Karim and Mark (2017) found MBR CAPEX runs roughly 20–40% higher than CAS for the same design flow, with MBR becoming the lower-cost option only beyond 67 years of operation. Bertanza et al. (2017) reached a similar conclusion: CAS performs better on pure economic metrics, while MBR provides superior environmental impact and social acceptance. For a Prosser-area site near agricultural land and the Yakima River, the social-acceptance component of this comparison is critical for the 2026 NPDES renewal.
Operating cost drivers differ between the two systems. MBR OPEX is dominated by membrane replacement every 5–10 years and aeration energy for the scour-air system. CAS OPEX is dominated by polymer, sludge hauling, and clarifier maintenance. Direct GHG emissions are nearly identical at 0.91 kgCO2eq/m³ for MBR versus 0.85 kgCO2eq/m³ for CAS (Mannina et al., 2019 plant-wide benchmark). This delta is reportable under Washington's CCA framework but is rarely the deciding line item.
Washington Dept. Ecology's 2024 general permit update for the Yakima Basin tightened TSS and BOD effluent limits, and 2026 individual permits are expected to track tighter still. A refinery MBR's stable <5 mg/L TSS provides headroom against future permit cycles. A CAS basin with a polishing filter can meet these numbers, but the operating margin is thinner and an oil event can jeopardize compliance in a single shift. The full per-m³ cost breakdown for 2026 is available in the 2026 MBR cost-per-m³ guide.
| Cost / Permit Item | CAS | MBR |
|---|---|---|
| CAPEX vs baseline | Baseline | +20–40% |
| Crossover to lower lifecycle cost | <67 years (Karim & Mark 2017) | >67 years |
| Direct GHG (kgCO2eq/m³) | 0.85 | 0.91 |
| Top OPEX driver | Polymer, sludge hauling, clarifier | Membrane replacement, scour air |
| Yakima Basin TSS margin (vs 2024 limits) | Thin | Comfortable |
Decision Matrix: When to Pick MBR vs CAS in Prosser
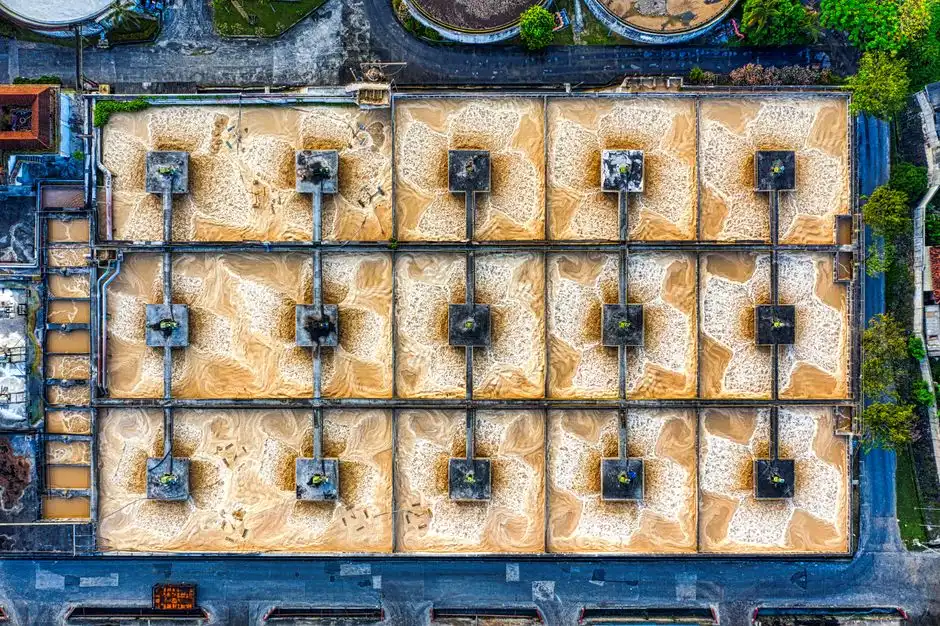
Pick MBR when the plot is constrained, the discharge limit is below 10 mg/L TSS, the refinery plans internal reuse, or oil & grease variability is high. Pick CAS when the project horizon is short, CAPEX is limited, land is available, and discharge goes to a municipal POTW with lenient limits. The economic threshold where CAS typically remains viable for petroleum duty is around 2,000 m³/day with 1+ hectare of available land; above that, footprint and reuse economics favor MBR.
Install a dissolved air flotation unit upstream in every scenario. DAF at 5–25 m/h hydraulic loading with >90% oil removal is the non-negotiable pre-step required for biological technology to survive a refinery feed. The detailed selection rules for DAF sizing are in the 2026 DAF design criteria guide.
For a typical Prosser-area petroleum site, the default is DAF + MBR unless flow exceeds ~2,000 m³/day and the site has the land to host a CAS basin plus a polishing filter. If the site already has a working CAS basin, the recommendation is generally to keep the CAS, add DAF upstream, and tighten the polishing step—unless the refinery requires sub-5 mg/L TSS for reuse, in which case a retrofit to an MBR using the existing basin as the biological reactor is appropriate. The MBR module engineering walkthrough covers the retrofit sequence.
Frequently Asked Questions
Is MBR or CAS better for petroleum wastewater with high oil & grease?
MBR is better, as it tolerates up to ~100 mg/L oil & grease at the membrane, while CAS clarifiers struggle with floc aggregation and bulking above ~50 mg/L. Both trains require a DAF unit upstream to reduce oil concentrations before the biological process.
How much smaller is an MBR footprint than CAS for refinery duty?
The MBR footprint is approximately 60% smaller. The integrated MBR skid replaces the secondary clarifier, most of the polishing step, and a portion of the aeration basin volume.
What is the 2026 CAPEX premium for MBR vs CAS at a Prosser refinery?
MBR CAPEX is 20–40% higher than CAS (Karim & Mark, 2017), with lifecycle cost parity occurring after roughly