Why Anaerobic Digester Maintenance Is a High-Stakes Discipline in 2026
A single pH excursion can drop COD removal by more than 40% in an anaerobic digestion system, because the resulting accumulation of long-chain fatty acids inhibits methanogens and stalls organic breakdown (per DUT upscaling study, 2024). That single number explains why a disciplined maintenance program is the difference between a digester that pays back its capital and one that drains it. Research on upscaled 50 L digesters showed benefit-cost ratios climbing from 0.05 at 1 L scale to 0.4 at 50 L once the system was stabilized — a clear signal that properly maintained, optimized units are the path to economic viability, while neglected ones are not (DUT, 2024).
The EPA AgSTAR Operator Guidebook remains the recognized O&M reference for AD and biogas systems in 2026, covering everything from feed characterization to gas safety (per EPA AgSTAR). Operators who anchor their procedures to that guidebook and layer in plant-specific data tend to outperform those running on tribal knowledge alone.
Maintenance failures in anaerobic digesters fall into four categories, and each demands a different response cadence:
- Biological — toxicity from ammonia, sulfides, or LCFA; microbial community imbalance from temperature shock or organic overload.
- Mechanical — mixer failure, feed pump seal wear, recirculation pump cavitation, gas compressor trips.
- Structural — tank wall or roof corrosion, gas leaks at seams, floating cover seal degradation.
- Process control — pH probe drift, ORP sensor fouling, gas flow meter under-reading, PLC setpoint errors.
Critical Process Parameters and Target Ranges
Operators need one consolidated reference they can pin above the control screen. The table below combines the parameter targets that drive stable digestion with separate alarm and shutdown thresholds so the O&M team knows when to react versus when to stop feeding entirely.
| Parameter | Optimum Target | Operating Range | Alarm Threshold | Shutdown Threshold |
|---|---|---|---|---|
| pH | 6.8–7.2 | 6.5–8.5 (enameltanks.com guidance, 2024) | < 6.6 or > 7.6 | < 6.2 or > 8.0 |
| Temperature (mesophilic) | 37°C | 35–38°C | < 34°C or > 39°C | < 32°C or > 41°C |
| Temperature (thermophilic) | 52°C | 50–55°C | < 49°C or > 56°C | < 47°C or > 58°C |
| HRT | 21 days (DUT, 2024) | 18–30 days | < 15 days | < 12 days |
| OLR (industrial) | 2.5 kg COD/m³/day | 1.0–5.0 kg COD/m³/day | > 6.0 kg COD/m³/day | > 8.0 kg COD/m³/day |
| VFA/TA ratio | < 0.3 | < 0.4 | > 0.5 | > 0.8 |
| Methane (CH₄) | 60–70% | 55–75% | < 55% | < 50% |
| Carbon dioxide (CO₂) | 30–40% | 25–45% | > 45% | > 50% |
| Hydrogen sulfide (H₂S) | < 100 ppm | < 200 ppm | > 500 ppm | > 1,000 ppm |
| Ammonia nitrogen | < 1,500 mg/L | < 2,000 mg/L | > 2,500 mg/L | > 3,000 mg/L |
A falling pH is the first signal that volatile fatty acids are accumulating faster than methanogens can consume them — the VFA/TA ratio is the earliest organic overload indicator because it shifts hours before pH does. Temperature swings of more than ±2°C per day kill specific microbial communities, and recovery can take two to three retention cycles. The DUT study found that adding inline sensors to the upscaled 50 L system lifted methane content to 90% — a concrete case for instrument calibration discipline (DUT, 2024).
Tiered Preventive Maintenance Schedule
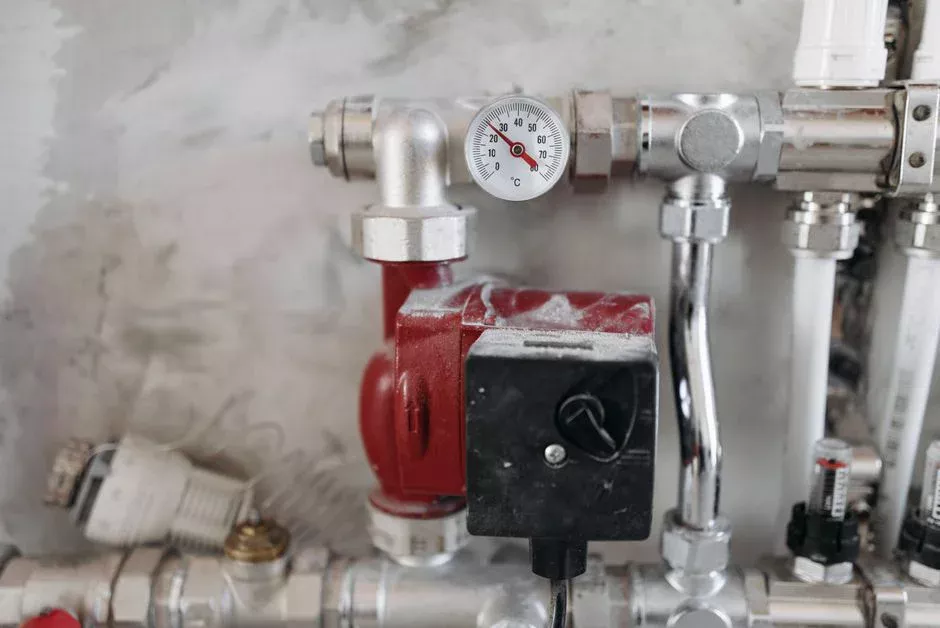
A maintenance schedule that operators can actually execute breaks the work into five tiers. The matrix below assigns each task a frequency and a typical duration so the O&M planner can staff it realistically. For a deeper symptom-based playbook, see the anaerobic digester troubleshooting guide.
| Tier | Frequency | Tasks | Typical Duration |
|---|---|---|---|
| Daily | Every shift | Log pH, temperature, gas flow, and feed rate; visual check of gas collection system; confirm mixer operation; record feed solids %. | 20–30 min |
| Weekly | Once per week | VFA and alkalinity titration with ratio calculation; gas composition check (CH₄, CO₂, H₂S); inspect feed screening equipment; sample for volatile solids. | 2–3 hr |
| Monthly | Once per month | Calibrate pH and temperature probes against buffer solutions; inspect mechanical bar screens and feed pumps; review biogas holder pressure trend; sample digester contents for VS and TS. | 4–6 hr |
| Quarterly | Every 3 months | Pull sludge profile for scum and grit accumulation; inspect mixers and recirculation pumps; review OLR against influent COD trend; pull and service one mixer at a time. | 1–2 days |
| Annual | Once per year | Full structural inspection of tank walls, roof, and floor; internal cleaning of accumulated sludge and scum using vacuum truck or pump (per enameltanks.com, 2024); gas system pressure test; safety device recertification; mixer gearbox oil change. | 3–7 days |
Daily logs should be reviewed by the lead operator every shift and trended weekly — pH drift of 0.1 over three consecutive days is a flag, not a noise band. Quarterly sludge profiling catches grit accumulation before it short-circuits flow patterns, and it pairs well with an upstream rotary mechanical bar screen audit to confirm screen aperture is actually protecting the digester from inert solids.
Routine Mechanical and Structural Inspection
Process engineers often delegate the mechanical and structural side of digester care to maintenance crews, but they must verify it on every quarterly walkdown. Tank roof, walls, and floor inspections target cracks, corrosion pitting, and gas leaks; any damage found should be repaired within the same quarter to prevent collapse or fugitive methane emissions (per enameltanks.com, 2024). Concrete digesters are particularly vulnerable to corrosion at the gas-liquid interface, where H₂S converts to sulfuric acid on exposed steel reinforcement.
Valves, pumps, and pipes have predictable wear points: mechanical seals on feed pumps typically last 18–24 months; check valves on gas lines fail more often in high-H₂S service; and recirculation pump impellers erode faster when grit bypasses the screens. Operators should stock critical spares for these items rather than waiting for a failure to order.
Mixer operation deserves its own inspection routine. Reduced mixing creates dead zones, scum buildup, and short-circuiting — all of which suppress biogas production without any obvious alarm. A simple test: pull a liquor sample at the top, middle, and bottom of the tank after a feed event; total solids should vary by less than 15% between ports. Sludge and scum removal uses a vacuum truck or pump for bottom solids, and a skimmer or scraper for floating scum (per enameltanks.com, 2024); accumulated solids reduce effective digester volume and digestion efficiency in direct proportion to the volume displaced.
Symptom-to-Cause Diagnostic Matrix
When a parameter drifts, the operator needs a fast path from observation to root cause. The matrix below pairs each common symptom with its likely cause, the diagnostic step that confirms it, and the corrective action that restores stability. For granular-sludge-specific failures, cross-reference the EGSB reactor troubleshooting guide.
| Symptom | Likely Cause | Diagnostic Step | Corrective Action |
|---|---|---|---|
| pH drops below 6.5 | Organic overload; LCFA accumulation (DUT, 2024) | Check VFA/TA ratio; review feed COD trend | Reduce feed rate by 30–50%; add alkalinity via automatic chemical dosing system; restore HRT to 21 days |
| Gas production falls 30%+ | Temperature shift; toxicity event | Check temperature log; test for ammonia, sulfides, LCFA | Restore setpoint temperature; identify and dilute toxicant; reseed if necessary |
| H₂S rises above 500 ppm | Sulfate in feed; iron dose depletion | Test feed sulfate; check iron chloride dosing rate | Increase iron dosing to Fe:S molar ratio of 1.5:1; pre-treat feed |
| Foam in gas line | Excess mixing; organic overload; filamentous growth | Check mixer RPM; review OLR; inspect foam for filamentous bacteria | Reduce mixing intensity; cut feed rate; add antifoam dosing |
| Scum layer > 300 mm | Poor surface mixing; grease overload | Measure scum depth at three points; review feed FOG content | Engage surface mixer or spray nozzle; skim scum; install grease trap upstream |
| Biogas production crashes after additive change | Catalyst overloading (e.g., magnetite > 0.8 g/L) | Review recent additive dose logs; per DUT, 0.8 g/L magnetite cut production from 23 to 2 mL/d | Stop additive dosing; dilute with water; re-establish baseline over 1–2 HRTs |
One caution from the DUT data: biogas production declined from 23 mL/d to 2 mL/d when magnetite loading exceeded 0.8 g/L (DUT, 2024). That is an over-correction case — an additive intended to enhance interspecies electron transfer became inhibitory. The lesson: any new additive, nutrient, or trace element should be dosed against a defined ceiling, not a "more is better" instinct.
Optimizing Digester Performance Through Maintenance
Maintenance discipline is what keeps a digester on its performance plateau. The DUT study identified an optimum at HRT 21 days, pH 7.01, and magnetite 0.42 g/L, achieving a desirability score of 0.99 with over 85% COD removal on low-organic streams and over 60% on high-organic sugar refinery streams (DUT, 2024). Those numbers are not theoretical — they are what a stabilized, well-maintained system delivers. Drift in any single parameter shifts the system off that optimum, and the cost shows up as reduced gas yield, increased sludge handling, or both. For downstream solids management, pairing stable digester performance with a plate and frame filter press on the dewatered biosolids side keeps the whole train running tight.
Payback periods in the DUT analysis ranged from 19.03 years at 50 L scale to 25.3 years at 10 L scale, with the benefit-cost ratio improving as systems scale up (DUT, 2024). Proactive maintenance extends equipment life and protects that ROI — a mixer gearbox replacement on a 5-year cycle costs far less than a tank integrity failure in year 12. For context on capital decisions, the UASB vs CSTR cost comparison breaks down the trade-offs.
The 2026 trend in instrumentation is clear: inline sensors for pH, ORP, and gas composition are becoming standard on both new builds and retrofits, cutting manual sampling labor by 50% or more. The next layer is ML-based predictive maintenance on sensor streams, which flags drift hours before a human would notice it in a log.
Safety, Compliance, and 2026 Monitoring Trends
Biogas is a methane-CO₂ mixture that becomes explosive at 5–15% methane in air, so leak detection, flame arrestors, pressure relief valves, and confined-space entry protocols are non-negotiable (per enameltanks.com, 2024). Every digester room should have a calibrated portable gas detector at the entrance, and every operator should know the evacuation route before they open a sample port.
Three trends are reshaping AD O&M in 2026. First, remote monitoring is now table-stakes — operators expect to view pH, temperature, and gas flow from a phone, and many plants integrate that data into their SCADA historian. Second, predictive maintenance via machine learning on sensor streams is moving from pilot to production; the leading vendors are flagging mixer bearing wear and probe drift weeks before failure. Third, methane emissions reporting is tightening across multiple jurisdictions, which means fugitive emission monitoring (often via drone or fixed IR cameras) is becoming a compliance line item rather than a voluntary add-on. For O&M staffing context against these new requirements, the wastewater plant labor cost benchmark shows how peer facilities are allocating headcount.
Frequently Asked Questions
What pH, temperature, and VFA/TA ratio should an industrial anaerobic digester target in 2026?
Target pH 6.8–7.2 with an operating range of 6.5–8.5, temperature 35–38°C mesophilic or 50–55°C thermophilic, and VFA/TA ratio below 0.3 (alarm above 0.5, shutdown above 0.8). These targets are drawn from the consolidated parameter table in this guide and validated by DUT upscaling work showing peak performance at pH 7.01 and 21-day HRT (2024).
How often should pH probes and temperature sensors be calibrated on an anaerobic digester?
Calibrate pH and temperature probes monthly against fresh buffer solutions and reference thermometers, and replace pH probes on a 12–18 month cycle or when slope drops below 95%. The DUT study found that sensor-based monitoring on the upscaled 50 L system enhanced methane content to 90% (DUT, 2024) — that result depends entirely on calibration discipline.
What is the most common root cause of a sudden pH drop in a mesophilic digester?
Organic overload leading to volatile fatty acid accumulation is the most common cause, confirmed by a VFA/TA ratio above 0.5 and a feed COD trend that has stepped up without an HRT adjustment. Corrective action is to reduce feed rate by 30–50%, dose alkalinity to restore buffering, and re-establish the 21-day HRT (DUT, 2024). For a full diagnostic walkthrough, see the anaerobic digester troubleshooting guide.
How often should accumulated sludge and scum be removed from an industrial digester?
Plan for annual internal cleaning of accumulated sludge and scum using a vacuum truck or pump for bottom solids and a skimmer or scraper for floating scum (per enameltanks.com, 2024). Quarterly sludge profiling tells you whether that annual cadence is correct or whether grit loading has pushed the interval shorter. For high-rate granular systems, the EGSB reactor troubleshooting guide covers sludge bed-specific issues.