Why Louisville Food and Beverage Plants Are Rethinking CAS Right Now
For a Louisville distillery, dairy, or meat processor, the binding compliance regime is the KPDES pretreatment program administered by the Kentucky Division of Water, layered on top of the Louisville MSD Industrial Wastewater Discharge Limits enforced at the plant tap. The KPDES permit typically governs oil and grease (O&G), total suspended solids (TSS), biochemical oxygen demand (BOD), chemical oxygen demand (COD), pH, and ammonia on the discharge side, while Louisville MSD's local limits add the daily and instantaneous maximum loading rates the plant has to stay under (per KPDES / Louisville MSD industrial discharge rules, 2026). For most food and beverage permittees, the practical ceilings that drive equipment design sit near O&G <10–15 mg/L, TSS <10 mg/L, BOD <10 mg/L on a daily-average basis, with reuse objectives pushing them tighter still.
The local industry mix makes those numbers harder to hit every month. Louisville and Jefferson County host bourbon distilleries along the Urban Bourbon Trail, dairy processors, meat and sauce plants, flavoring manufacturers, and contract co-packers running batch cleaning-in-place (CIP) every 8 to 16 hours. Each of those operations generates high FOG, warm effluent in the 30–40 °C range, and sharp BOD spikes tied to batch release, all of which stress a conventional activated sludge (CAS) basin. The recurring failure pattern across the cluster is filamentous bulking after a sanitizer or FOG upset, sludge washout from the secondary clarifier, and TSS excursions that show up the next business day in permit sampling. Retrofit the existing CAS, swap to membrane bioreactor (MBR), or hybridize the train — that is the question this article answers with numbers.
How Conventional Activated Sludge Works in a Food and Beverage Plant
A CAS train at a typical F&B plant runs screening, grit removal, flow equalization, primary clarification or a DAF pre-treatment system for FOG stripping, an aeration tank, a secondary clarifier, and disinfection. Solids separation is done entirely by gravity in the clarifier; the operator's job is to keep the sludge blanket stable so the settled solids stay under the weirs.
Standard operating parameters sit in a narrow band: mixed liquor suspended solids (MLSS) of 2,000–4,000 mg/L, hydraulic retention time (HRT) of 6–12 hours, sludge retention time (SRT) of 5–15 days, and clarifier surface loading of 0.5–1.5 m/h (HydropureWater engineering data, 2026). Removal benchmarks under steady load are COD 85–92%, BOD 85–95%, and total nitrogen (TN) 50–70% when an anoxic zone is included. Pathogen removal is minimal without a downstream UV or chlorine step.
The F&B-specific weaknesses show up in the same places on every upset: poor FOG tolerance if the upstream DAF is undersized or out of service, sensitivity to CIP pH swings and temperature spikes, sludge blanket upsets in the clarifier during peak flow, and a large return/waste activated sludge (RAS/WAS) handling burden that ties up tankage and labor. None of these are deal-breakers on their own, but stacked together they explain why the same CAS plant can run compliant for six months and then miss a TSS limit three sampling days in a row after a single CIP event.
How an MBR System Re-engineers the Same Job
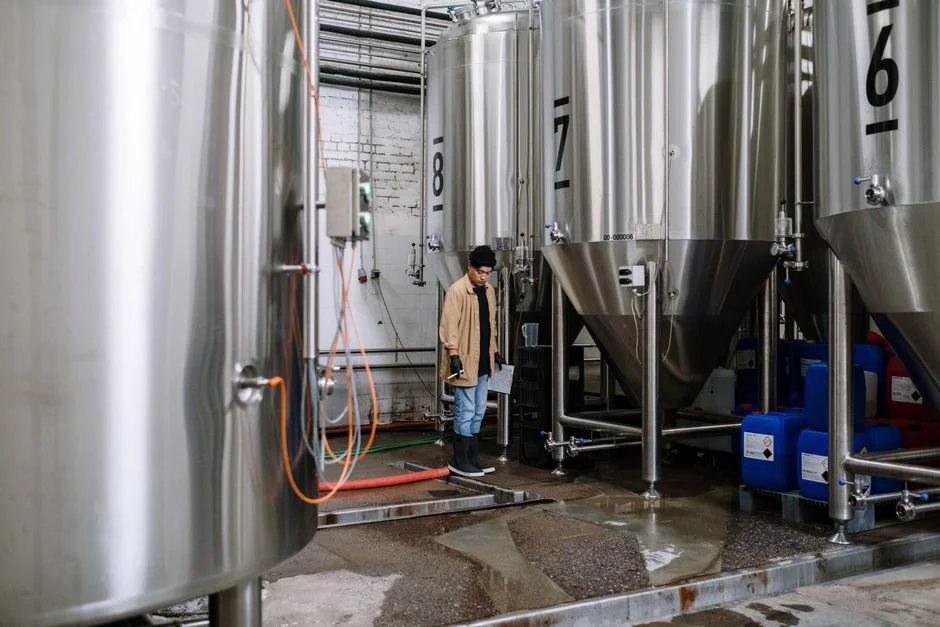
An MBR train physically replaces the secondary clarifier with a submerged membrane cassette. The path runs screening, grit, a DAF or equalization basin, then a bioreactor holding submerged PVDF ultrafiltration modules with a 0.1–0.4 μm pore size, and finally permeate to disinfection or direct reuse (HydropureWater engineering data, 2026). Solids separation is now a physical barrier, not gravity, which is what changes every downstream number.
Operating parameters shift hard: MLSS rises to 8,000–12,000 mg/L, HRT shortens to 4–8 hours, and SRT extends to 20–50 days because the membrane holds biomass that the clarifier would have wasted. Effluent routinely lands below 1 mg/L TSS and below 0.2 NTU turbidity, the same envelope Singapore's NEWater program treats as reusable (HydropureWater engineering data, 2026). Removal benchmarks are COD 92–97%, BOD 95–99%, and TN 70–90% with an anoxic zone, plus 4–6 log bacteria and 2–3 log virus removal consistent with WHO 2023 reuse guidance.
Membrane care is the new operator discipline: continuous aeration scouring, transmembrane pressure (TMP) monitoring, and a chemical-enhanced backwash (CEB) or clean-in-place (CIP) every 3–6 months using citric acid or NaOCl, with module life of 5–10 years (HydropureWater engineering data, 2026). Equipment choices matter here, and a packaged integrated MBR wastewater treatment system built around a DF series MBR flat sheet membrane module typically arrives with the scour blower geometry, cassette racking, and CIP loop pre-engineered so the plant is not reinventing them on site. Membrane area density and air-scour uniformity are the two design choices that decide whether the system runs at 0.4 kWh/m³ or fights fouling at 0.8 kWh/m³ for the next decade.
Side-by-Side Comparison: MBR vs CAS for Food and Beverage Wastewater
| Parameter | CAS | MBR | F&B verdict |
|---|---|---|---|
| Footprint (m²/m³/day) | 0.5–1.0 | 0.1–0.3 | MBR wins on urban-industrial land cost |
| MLSS (mg/L) | 2,000–4,000 | 8,000–12,000 | MBR holds more biomass per tank |
| HRT (h) | 6–12 | 4–8 | MBR halves the aerobic tankage |
| SRT (d) | 5–15 | 20–50 | MBR retains slower-growing, shock-resilient bugs |
| COD removal | 85–92% | 92–97% | MBR pulls tighter on the same influent |
| BOD removal | 85–95% | 95–99% | MBR clears reuse thresholds without polishing |
| TN removal (with anoxic zone) | 50–70% | 70–90% | MBR hits effluent ammonia on a single pass |
| Effluent TSS | 10–30 mg/L | <1 mg/L | MBR's defining advantage |
| Pathogen log removal | Minimal (needs UV/Cl₂) | 4–6 log bacteria, 2–3 log virus | MBR replaces a disinfection skid |
| Energy (kWh/m³) | 0.3–0.5 | 0.5–1.0 | CAS wins on energy, loses on TSS |
| Sludge yield (kg TSS/kg COD) | 0.4–0.6 | 0.1–0.3 | MBR produces less waste solids |
| FOG / shock tolerance | Moderate (needs equalization) | High (handles COD spikes to 3,000 mg/L) | MBR survives what kills a clarifier |
The table is the article's data anchor for a reason: every cell is a number an engineer can defend in a permit review. CAS catches up to MBR on effluent TSS only if you bolt on tertiary filtration (sand filter or UF) plus UV, which closes most of the footprint and CAPEX gap that made CAS attractive in the first place. By the time CAS is wrapped in the polishing train a buyer actually needs, the lifecycle math usually lands inside 15–20% of the MBR number — before counting the reuse credit.
Food and Beverage Stress Test: FOG, CIP Surges, BOD Spikes, Temperature
| Stressor | CAS behavior | MBR behavior |
|---|---|---|
| FOG >100 mg/L after DAF | Emulsified oil carries over, scum layer forms, bulking risk | Higher MLSS and longer SRT polish residual oil to <5 mg/L |
| CIP surge (pH 4 → 10 swing) | Filamentous growth at SRT 5–15 d, clarifier sludge washout | Biomass holds at SRT 20–50 d, recovers within 24–48 h |
| BOD spike to 2,000–3,000 mg/L | Requires equalization; clarifier overloads on diurnal peak | Handles spikes to 3,000 mg/L without washout |
| Temperature 30–40 °C | Faster kinetics but poor settling in clarifier | Faster kinetics plus no settling step, net positive |
| Reuse demand (cooling tower, boiler) | Needs tertiary filtration + disinfection skid | Permeate often meets reuse spec directly |
FOG is the master variable in any F&B comparison. Both trains need a DAF upstream, but the DAF does not catch emulsified oil after a CIP event, and that is the fraction that decides whether the biological step runs clean. A HydropureWater field project at a Shandong food plant showed MBR cutting COD from 1,200 mg/L to below 50 mg/L on the same influent where comparable CAS only reached approximately 150 mg/L (HydropureWater field data, 2026). CIP surges are the second killer: caustic and acid cleaning events depress pH and push BOD, and at the SRT 5–15 day window CAS simply does not retain the diverse, shock-resilient biomass that MBR holds at 20–50 days. Warm distillery and dairy streams favor biological kinetics but penalize clarifier settling — which MBR sidesteps entirely. Finally, the reuse pull is what turns MBR's <1 mg/L TSS and <0.2 NTU effluent from a luxury into a revenue line under Louisville MSD non-potable reuse programs and on-site boiler or cooling make-up, the same logic that supports sibling MBR vs CAS guide for another food and beverage cluster and the food and beverage pretreatment compliance guide.
Cost Reality Check: USD CAPEX, OPEX, and 20-Year Lifecycle in the U.S.
| Cost line | CAS (USD) | MBR (USD) | Notes |
|---|---|---|---|
| Installed CAPEX (per m³/day, packaged) | $12,000–$24,000 | $23,000–$50,000 | MBR = China baseline × 1.5–2.0 U.S. multiplier; rough order-of-magnitude |
| Energy (per m³ treated) | $0.30–$0.50 | $0.50–$1.50 | MBR includes membrane scouring air |
| Chemicals — CIP + polymers (per m³) | $0.04–$0.12 | $0.20–$0.40 | Citric acid, NaOCl for membrane; polymers for CAS sludge |
| Sludge disposal (per m³) | $0.15–$0.45 | Lower per m³, higher dewatering energy | Yield 0.4–0.6 vs 0.1–0.3 kg TSS/kg COD; consider a plate and frame filter press for cake dryness |
| 20-year all-in lifecycle (per m³) | $3.50–$6.50 | $5.00–$9.00 | Includes membrane replacement every 5–10 years |
| Reuse credit (per m³, illustrative) | Not applicable | $1.50–$3.00 | Displaces purchased water or boiler make-up; recoups MBR premium in 3–6 years for a 200–500 m³/day plant |
The China-baseline data in S5 needs an explicit U.S. multiplier before it means anything to a Louisville procurement team: U.S. installed costs run 1.5–2.0× the China baseline, so MBR CAPEX of ¥15,000–25,000 per m³/day lands at roughly $23,000–$50,000 per m³/day for a packaged unit, and CAS of ¥8,000–12,000 lands at roughly $12,000–$24,000 per m³/day (HydropureWater engineering data, 2026). Those are rough order-of-magnitude figures, not firm quotes, and they exclude site civil work, building envelope, and the influent lift station. The 20-year lifecycle numbers — MBR $5.00–$9.00/m³ and CAS $3.50–$6.50/m³ all-in — already include membrane replacement. The line that flips the decision is reuse: at $1.50–$3.00/m³ of displaced purchased water or boiler make-up, the MBR capex premium for a 200–500 m³/day plant recoups in 3–6 years on a defensible payback model. For deeper budget detail, the 2026 MBR cost and sizing guide walks the line items, and the MBR maintenance protocol guide covers the OPEX side once the plant is running.
Louisville Decision Framework: Pick the Right Train for Your Plant
Step 1: Pull the KPDES permit and Louisville MSD discharge limits. If your permit requires TSS <10 mg/L, O&G <10–15 mg/L, or any reuse mandate, MBR is the lower-risk path. CAS will need a tertiary filtration train bolted on to meet the same numbers, which closes the CAPEX gap.
Step 2: Map the influent. FOG >100 mg/L, BOD >1,500 mg/L, or batch CIP that drives more than 2× diurnal flow swings are the three triggers where MBR's shock absorption pays back fast. Steady, low-FOG influent does not pay for MBR.
Step 3: Audit the footprint. Under 0.5 m²/m³/day available? MBR. Above 1.0 m²/m³/day and no reuse goal? CAS remains competitive on CAPEX, especially at a greenfield site with cheap land.
Step 4: Run the lifecycle in USD with a reuse credit. Apply the 1.5–2× U.S. multiplier to the China baseline, model 20 years, and credit reuse at $1.50–$3.00/m³. The payback delta is the number that goes to the CFO.
Step 5: Confirm operator capability. CAS needs clarifier and sludge-blanket expertise. MBR needs membrane, TMP, and CIP discipline. Mismatched capability is the most common reason a good technology choice underperforms in year two.
The hybrid option is worth naming: an existing CAS aeration basin can be retained and the secondary clarifier replaced with a membrane cassette, which preserves the sunk cost of the aeration tank while buying MBR's effluent quality. That is often the right answer for a Louisville plant with a 10- to 20-year-old CAS basin and a TSS limit that no longer tolerates clarifier washout.
Frequently Asked Questions
What TSS and BOD can a Louisville food and beverage plant realistically expect from MBR versus CAS?
MBR routinely delivers effluent TSS below 1 mg/L and BOD removal of 95–99%, while CAS under steady F&B load typically lands at 10–30 mg/L TSS and 85–95% BOD removal. The MBR numbers are what satisfy reuse-grade discharge and most KPDES / Louisville MSD limits without a polishing skid (HydropureWater engineering data, 2026).
How does MBR handle FOG and CIP surges compared to CAS?
MBR's 8,000–12,000 mg/L MLSS and 20–50 day SRT retain a more diverse, shock-resilient biomass than CAS at 2,000–4,000 mg/L MLSS and 5–15 day SRT, so it absorbs FOG breakthrough and CIP pH swings with limited performance loss. Field data shows MBR cutting COD from 1,200 mg/L to below 50 mg/L on a food plant influent where comparable CAS reached only approximately 150 mg/L (HydropureWater field data, 2026).
Is the MBR capex premium recoverable through water reuse at a Louisville plant?
Yes, in most cases. If treated water displaces Louisville MSD purchase or on-site boiler / cooling make-up at $1.50–$3.00/m³, the MBR capex premium for a 200–500 m³/day plant typically recoups in 3–6 years, before counting avoided tertiary filtration and lower sludge disposal. Plants with no reuse demand and ample land do not see the same payback, and CAS remains the rational choice there (HydropureWater engineering data, 2026).