Why Effluent Ammonia Spikes and What It Costs You
High effluent ammonia is almost always a nitrification upset, and the permit clock starts the day your NH3-N crosses its limit — typically 1–10 mg/L depending on receiving water classification and regional rules. Nitrification is a two-step biological oxidation: Nitrosomonas (AOB) convert NH4 to NO2, and Nitrobacter (NOB) finish the job at NO3. Both genera are obligate aerobes, which means they die without free molecular oxygen. The full conversion matters because ammonia and nitrite are independently toxic and independently enforceable — a half-finished nitrification that piles up NO2-N can keep you out of compliance even as raw NH3-N looks low. The business impact is straightforward: nitrifier populations recover naturally over weeks to months because of their slow growth (yield around 0.15 lb cells per lb NH3-N oxidized, per EnviroZyme), and during that window fines accrue daily while receiving-water toxicity risk continues. Operators under an active exceedance need a same-shift diagnostic. Confirm dissolved oxygen at 1.5–3.0 mg/L, mixed liquor temperature near 30°C, pH 7.5–8, and alkalinity above 100 ppm as CaCO3, then check for toxic loading (metals, quaternary ammonium cleaners) or rising influent ammonia load. Each kg of NH4 oxidized needs 4.6 kg of O2 and 7 lb of alkalinity — those two ratios explain most of what goes wrong.
Effluent Ammonia Diagnostic Matrix: Symptom to Root Cause
The first job during an ammonia spike is to identify which subsystem failed, rather than starting chemical dosing. The matrix below maps the four patterns operators see on a SCADA trend to the most likely root cause, the confirmatory test, and the in-house tool that resolves it. Per field data, the three most common findings during an ammonia exceedance are a sudden DO crash, mixed liquor below 15°C in cold weather, and a quaternary ammonium cleaner slug from a sanitation crew (HydropureWater field data, 2026).
| Symptom in effluent | Likely root cause | Confirmatory measurement | Fastest in-house test |
|---|---|---|---|
| NH3-N rising gradually, NO3-N falling, basin temp < 15°C | Cold-weather nitrification slowdown | Mixed liquor temperature profile across tank | Calibrated DO/temperature probe at end of basin |
| NH3-N spikes within 24–72 hours, DO probes show < 1.0 mg/L | DO crash / aeration failure | Residual DO at end of aeration tank, blower output, air distribution | Portable DO probe at three tank stations |
| NH3-N and NO2-N both elevated, no temperature or DO change | Toxic slug (Cu, Ni, Zn, quat cleaners) | Influent trace metals log, sanitation chemical use log | Microscopic exam for dispersed/necrotic floc |
| NH3-N climbs with pH falling below 7.0 and alkalinity < 60 ppm | Alkalinity depletion from nitrification itself | Alkalinity titration, pH profile | Hand titration kit, pH meter |
| NH3-N rises while TSS and turbidity in effluent also climb | Nitrifier washout from sludge loss / short SRT | SRT calculation, RAS rate, clarifier blanket depth | SVI and 30-min settling test |
Root Cause 1 — Dissolved Oxygen and Aeration Capacity

Dissolved oxygen is the single most common cause of a nitrification upset. Nitrifiers require a minimum of 1.5 mg/L, achieve significant rates between 2.0 and 2.9 mg/L, and reach maximum activity at 3.0 mg/L; below 0.5 mg/L, nitrification ceases outright (per EnviroZyme nitrification guidance). They are obligate aerobes, but they tolerate short-term oxygen deprivation — an absence of DO for less than 4 hours is generally recoverable, while anything longer starts killing the population. The oxygen demand math explains why a small ammonia load can starve a basin: nitrification consumes 4.6 kg of O2 per kg of NH4 oxidized, versus only 1 kg of O2 per kg of carbonaceous BOD. If your basin was sized for BOD removal, an added ammonia load silently quadruples its oxygen appetite. The diagnostic action is to verify residual DO at the end of the aeration tank, not just the middle — the back half is where nitrification finishes and where a starving system shows up first. Also check blower output, diffuser fouling, and air distribution. The cheapest immediate fix in an active upset is to raise DO to 2.5–3.0 mg/L and hold it there while you work the rest of the matrix.
Root Cause 2 — Temperature, pH and Alkalinity
Three parameters drift together through seasonal transitions and quietly push nitrification off its optimum. Temperature sets the rate: the optimum is 30°C, with poor efficiency below 15°C and above 35°C — so a winter basin in a northern climate can lose 50–70% of its summer nitrification rate simply because the biology slowed. pH sets the substrate form: nitrification is acceptable from 6.5 to 9, with the best rates above 7.5 and below 8; acidic conditions are particularly adverse and shut the reaction down faster than operators expect. Alkalinity is the buffer that keeps pH in the window — the reaction consumes about 7 lb of alkalinity (as CaCO3) for every 1 lb of NH3-N oxidized. The optimum is below 100 ppm, and the reaction will continue down to 40 ppm before it stops (per EnviroZyme). The classic failure pattern is a pH drop paired with alkalinity below 80 ppm: nitrification is consuming its own buffer, and if you don't dose alkali the reaction will self-arrest within days. A practical field tip: dose alkali to bring pH to 7.5–8.0 and CaCO3 above 100 ppm before nitrification fully crashes, using an automatic chemical dosing system for alkali feed tied to inline pH and alkalinity monitoring.
| Parameter | Optimum | Acceptable range | Cessation / failure point |
|---|---|---|---|
| Temperature | 30°C (86°F) | 15–35°C | < 15°C poor efficiency; > 35°C inhibitory |
| pH | 7.5–8.0 | 6.5–9.0 | Acidic (< 6.5) particularly adverse |
| Alkalinity (as CaCO3) | < 100 ppm | 40–100 ppm (still proceeds) | Below 40 ppm effectively stops |
| Dissolved oxygen | 3.0 mg/L | 1.5–2.9 mg/L | < 0.5 mg/L ceases |
Root Cause 3 — Toxicity, Loading and Sludge Washout
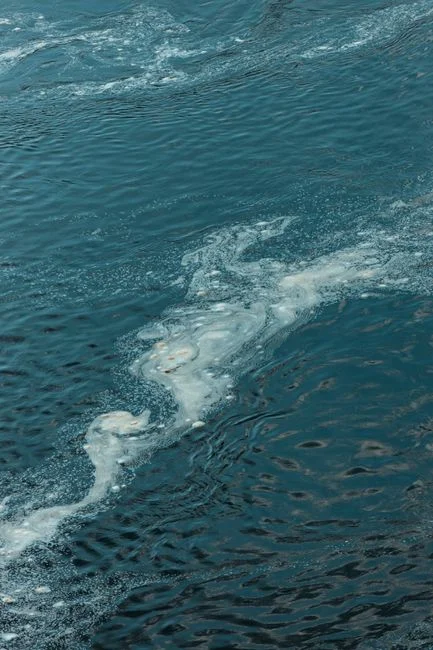
When DO, temperature, pH and alkalinity all check out, the cause is usually a process-side problem that needs an audit, not a probe recalibration. Toxicity is the first suspect: heavy metals (Cu, Ni, Zn) are needed in trace amounts but become inhibitory at higher concentrations, and FOG or process chemicals can smother floc. The most common field culprit is a quaternary ammonium cleaner slug from a sanitation crew hitting the head of the plant — that single event can wipe out a nitrification basin in one shift. The second suspect is loading: confirm whether influent NH3, BOD, or COD has risen past design. Nitrifier yield is only 0.15 lb cells per lb NH3-N oxidized, so under overload the biomass cannot reproduce fast enough to keep up. Audit influent sources: proteins, blood, urea, amino acid products, casein, corrosion inhibitors, raw materials, and quat cleaners are the usual NH3 contributors (per EnviroZyme 8-step guidance). The third suspect is sludge age. Nitrifiers are slow-growing autotrophs and need a high SRT to maintain population — check for unintended sludge loss from clarifier blanket drift, foaming events, or a failed RAS pump. Finally, run a nutrient check: phosphorus in particular becomes deficient in a nitrifying system, and trace Ca, Fe, Mg, Mo, Cu, Ni, Zn should be present but not excessive. A microscopic exam of floc — looking for dispersed, necrotic, or pinpoint floc with low ciliate activity — confirms toxicity in minutes.
2026 Fix Playbook: Immediate, Short-Term and Long-Term
The following table ranks standard responses by speed-to-result, helping operators select the right intervention without delay. In an active exceedance, execute immediate and short-term actions in parallel to stabilize biology and ensure compliance.
| Timeframe | Action | Expected result | Risk / cost note |
|---|---|---|---|
| Same shift | Raise DO to 2.5–3.0 mg/L; verify blower and diffuser output; halt any known quat-amm cleaner dosing upstream | Stops further nitrifier die-off within hours | Low cost; limited by blower capacity |
| 1–7 days | Add alkalinity to pH 7.5–8.0 and CaCO3 > 100 ppm; run ammonia stripping on a side-stream at pH 10.8–11.5 with lime or caustic | Stabilizes pH; stripping removes 80–95% NH3 on high-strength streams | Stripping needs towers and ongoing chemical spend |
| 1–7 days | Bioaugment with a supplemental nitrifier culture containing both AOB and NOB to seed the two-step conversion while root cause is fixed | Recovery compressed from weeks/months to days | Per EnviroZyme protocol; culture cost low vs daily fines |
| 2–12 weeks | Re-rate aeration capacity; add a parallel MBR membrane bioreactor for capacity-limited sites or an MBBR stage (see MBBR engineering guide); install online NH3 and DO monitoring | Stable long-term ammonia compliance; smaller footprint for MBR | Higher capex; lowest total cost of ownership where biology can be stabilized |
Ammonia stripping is reserved for high-strength or shock-loaded streams where biological recovery time is unacceptable, given the need for dedicated towers and ongoing lime or caustic usage. Where biology can be stabilized, bioaugmentation combined with a long-term capacity fix typically offers the lowest total cost of ownership (HydropureWater field data, 2026).
Equipment and Monitoring Checklist to Prevent Recurrence
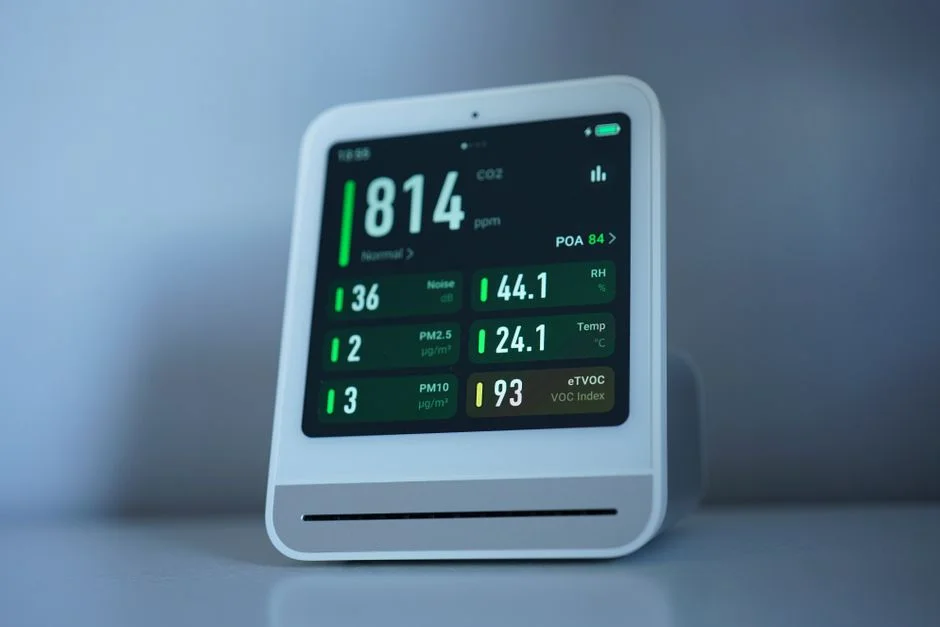
An ammonia exceedance is almost always preceded by a window where the right measurement would have caught the trend. Specify the following hardware and instrumentation during the recovery phase to prevent repeat failures. Place online DO probes at the end of the aeration basin on an auto-control loop to the blowers — this captures DO drift before it reaches critical levels. Add inline pH and alkalinity monitoring tied to an automatic chemical dosing system for alkali feed so buffer loss is corrected the moment it crosses setpoint. Upstream, install a rotary mechanical bar screen for headworks protection to keep rags and FOG from upsetting aeration tanks and clarifiers. For solids control where sludge loss is driving nitrifier washout, add a DAF system for FOG and solids control or a high-efficiency sedimentation tank to protect SRT. Finally, for sites where biology and clarification are coupling poorly and footprint is constrained, plan an MBR upgrade path using the MBR membrane bioreactor for capacity-limited sites.
Frequently Asked Questions
How long does it take for nitrifying bacteria to recover after a crash?
Naturally, nitrifier populations recover over weeks to months because of their slow growth (around 0.15 lb cells per lb NH3-N oxidized, per EnviroZyme). With bioaugmentation using a supplemental culture containing both AOB and NOB, the two-step nitrification can be re-seeded
Frequently Asked Questions
How do I troubleshoot high ammonia in wastewater effluent?
Begin by verifying your process control parameters, specifically checking that Dissolved Oxygen (DO) levels are above 2.0 mg/L and that the Mixed Liquor Volatile Suspended Solids (MLVSS) concentration is sufficient to maintain an adequate Mean Cell Residence Time (MCRT). Review your influent data for toxic shocks, pH excursions outside the 6.5 to 8.5 range, and sudden temperature drops that may inhibit Nitrosomonas and Nitrobacter populations.
If process parameters are stable, perform a diagnostic profile of the aeration basin to identify zones of short-circuiting or dead spots. Verify that the sludge age is long enough to support nitrifying bacteria, typically requiring an MCRT of 8 to 20 days depending on wastewater temperature, and confirm that there is no significant inhibitory interference from heavy metals or high-strength industrial discharges.
What dissolved oxygen level is needed for nitrification?
For optimal nitrification, maintain a residual Dissolved Oxygen (DO) concentration between 2.0 mg/L and 3.0 mg/L in the aeration basin. Nitrifying bacteria are obligate aerobes, and while they can survive at lower levels, rates of ammonia oxidation decrease significantly once DO levels drop below 1.5 mg/L.
It is important to note that maintaining higher DO levels, such as 3.0 mg/L or above, may be necessary during cold weather operation or when the biomass is recovering from a toxic event. Avoid excessive DO levels above 4.0 mg/L, as this can lead to energy inefficiency and potential foaming issues in the secondary clarifiers.
Why is my effluent ammonia rising in winter?
The primary cause of seasonal ammonia spikes is the temperature sensitivity of nitrifying bacteria, which experience a significant reduction in metabolic activity as water temperatures drop below 15°C. Nitrification rates are roughly halved for every 10°C decrease in temperature, requiring a longer MCRT to retain the necessary biomass in the system.
To compensate for these kinetics, operators must increase the sludge age during winter months to prevent the washout of nitrifying organisms. If the system is operating at its maximum design capacity, the reduction in biological activity will inevitably result in higher effluent ammonia concentrations until warmer temperatures return.
How much alkalinity does nitrification consume?
The biological oxidation of ammonia to nitrate is an acid-producing process that consumes approximately 7.14 milligrams of alkalinity (measured as CaCO3) for every 1.0 milligram of ammonia-nitrogen oxidized. Because nitrification is highly sensitive to pH, it is essential to maintain an alkalinity residual of at least 50 mg/L in the aeration basin to prevent the pH from dropping below 6.5, which would inhibit the nitrifying bacteria.
If the influent wastewater does not contain sufficient natural alkalinity, supplemental chemical addition—typically using sodium bicarbonate, magnesium hydroxide, or caustic soda—must be implemented to buffer the system. Failure to maintain adequate alkalinity will lead to a rapid acidification of the process and a total loss of nitrification capacity.
When should I use ammonia stripping vs biological treatment?
Biological treatment is the standard and most cost-effective method for municipal and low-to-medium strength industrial wastewater, capable of achieving effluent ammonia levels below 1.0 mg/L. It should be the primary choice for any facility that has the tank volume and aeration capacity to support a stable nitrifying population.
Ammonia stripping is generally reserved for high-strength industrial waste streams where ammonia concentrations exceed 500–1,000 mg/L, as these levels are often toxic to biological sludge. Stripping is also appropriate when the effluent requires ammonia removal but the facility lacks the footprint for large biological reactors or when the wastewater contains non-biodegradable inhibitors that would render biological processes ineffective.