Why Polymer Cost per Pound Misleads Most Plants
Cationic and emulsion polymers for sludge dewatering are specialty chemicals priced at $1.90-$3.00 per pound of product, and many emulsions track petroleum pricing, so a 10-15% spot swing is common (source: U.S. Water, 2026). That unit price tells an operator almost nothing about actual treatment cost. A polymer that costs 20% less per pound but drops solids capture from 95% to 75% raises recycle load, hauling volume, and disposal fees; in most side-by-side audits, the cheaper product ends up costing 10-25% more in total OPEX (source: U.S. Water field data, 2026).
Four hidden cost drivers sit behind every polymer invoice: active polymer content, the dose required to reach a target clarity, the capture efficiency actually achieved, and the downstream dewatering performance the polymer enables. Buy on the wrong one and every other lever is forced off-target. The controlling metric is cost per dry ton of solids treated, computed from dry solids feed, polymer feed rate, and active concentration (source: U.S. Water, 2026). Plants that benchmark on that single number typically reduce active polymer use 20-40% while holding or improving capture efficiency, because the metric aligns dose, chemistry, and equipment performance in one number.
Measure Active Polymer Content Before You Compare Products
Active polymer content is the single most common source of phantom dose variance. An emulsion labeled "neat" may carry 30-50% active solids; a solution polymer may carry only 5-15%; a dry product can be near 100% (source: U.S. Water, 2026). Two vendors quoting the same $/lb can therefore deliver a 3-5× difference in working polymer. The fix is a 24-hour bench test: weigh 2-3 mL of neat liquid into a pre-tared dish, dry at 105°C overnight, cool in a desiccator, and reweigh. Active content = (final mass / initial mass) × 100.
Once active content is known, every dose must be normalized to pounds active per dry ton of solids. That single conversion makes competing products, lots, and physical forms directly comparable. Re-verify on every new drum or tote; emulsion stability drifts in storage, and ambient warehouses above 35°C can drop active content by 2-4 percentage points over a quarter. Quarterly re-verification catches drift before it shows up as an unexplained capture loss (HydropureWater field data, 2026).
| Physical form | Typical active content | Carrier | Storage note |
|---|---|---|---|
| Liquid emulsion | 30-50% | Oil + water | Track petroleum index; avoid >35°C storage |
| Solution polymer | 5-15% | Water | Lower shelf life; check for phase separation |
| Dry granular | ~100% | None | Wetting errors common; needs 30-90 min maturation |
| Mannich polymer | 8-12% | Water | High cationic activity; verify by oven method |
For plants using a PLC-controlled automatic polymer make-down and dosing system, the active content value should be entered into the dosing controller as a calibration constant, so flow-paced output is automatically corrected for the lot in service.
Run a Proper Jar Test to Pick Chemistry and Set the Dose Floor
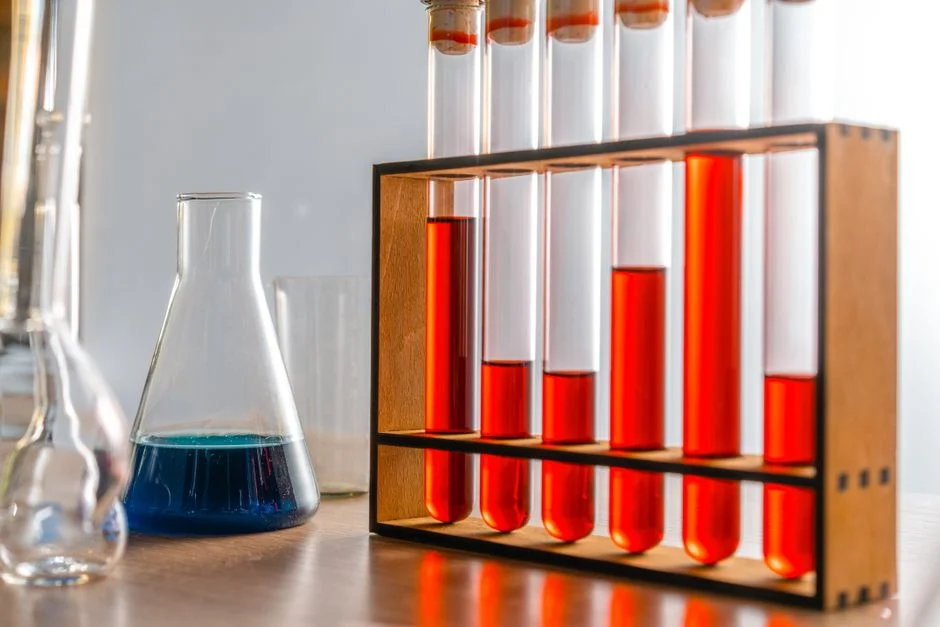
Jar testing identifies the minimum effective dose for a specific sludge. A representative grab must be collected from the dewatering feed, not the digester, and characterized for total solids (TS), volatile solids (VS), pH, and temperature. A 1°C swing in feed temperature can move the optimum dose by 5-10% on temperature-sensitive biosolids.
- Screen 3-5 cationic charge densities across the typical 10-100% range and 3-5 molecular weights (low, medium, high).
- Dose each combination at 2, 5, 10, 15, 20, 25, and 30 lb active per dry ton of feed solids.
- Mix in a gang stirrer: rapid mix at 200 rpm for 30 seconds, slow mix at 30 rpm for 2 minutes, settle 5 minutes.
- Record floc size, supernatant turbidity, and settled-sludge volume at each cell.
- Build a dose-response curve; the dose just past the visual break point — where additional polymer no longer improves clarity or floc size — is the minimum effective dose.
Re-run the jar matrix weekly during commissioning and after any upstream change: a shift in waste activated sludge (WAS) inventory, a digester temperature excursion, or a new fats-oils-grease (FOG) load will each push the optimum charge density by 10-20%. Plants that pin the dose from a one-time jar test typically over-dose by 15-30% within a quarter. For more detail on translating jar results into a working PAM dosing system design and cost guide for food and beverage plants, the protocol is the same regardless of industry.
Match Polymer Demand to Your Dewatering Equipment
Equipment type sets a hard floor on polymer demand because shear and residence time change the conditioning work the polymer must do. Centrifuges operate at 2,000-3,500 G and generate the highest shear, so they consume 10-20 lb active polymer per dry ton at 20-25% cake solids. Belt presses sit at 4-10 lb/ton at 20-28% cake solids for low-to-medium biosolids. Screw presses need 8-15 lb/ton at 18-30% cake solids, and pre-thickening ahead of a screw press will cut that demand sharply. Plate and frame filter presses need 6-12 lb/ton but reach 25-35% cake solids, which delivers the best polymer economy on a $/dry ton basis because the dryness half of the equation outweighs the dose (HydropureWater field data, 2026). Volute thickeners use only 3-6 lb/ton because they are thickening, not dewatering, and the cake is typically 12-18% solids.
| Equipment | Active dose (lb/dry ton) | Typical cake solids | Polymer cost lever |
|---|---|---|---|
| Belt filter press | 4-10 | 20-28% | Track tension, belt speed, shower flow |
| Decanter centrifuge | 10-20 | 20-25% | Pool depth, bowl speed, differential |
| Screw press | 8-15 | 18-30% | Pre-thickening cuts demand sharply |
| Plate and frame filter press | 6-12 | 25-35% | Highest dryness; best $/dry ton |
| Volute thickener | 3-6 | 12-18% | Thickening duty only |
Mechanical constraints often override chemical efficiency when polymer consumption exceeds the equipment band. If a plant's current dose is more than 30% above the equipment band, the binding constraint is usually mechanical — worn belts, wrong bowl speed, plugged filter cloth — not chemistry. A plate and frame filter press for sludge dewatering running 30% over its polymer band almost always has a cloth or feed-pressure problem. Confirm the mechanical baseline before changing chemistry.
Fix Dosing Equipment and Maturation Before Adding More Polymer

The most common cause of chronic over-dose is upstream of the chemistry. Under-matured polymer looks thin in the beaker, so the operator raises the pump; the result is 10-25% over-dose with no benefit in capture. Emulsion polymers need 30-60 minutes of maturation at 0.5-1.0% make-down concentration; dry polymers need 30-90 minutes at 0.05-0.3% (HydropureWater field data, 2026). A PLC-controlled automatic polymer make-down and dosing system with conductivity-controlled water blending eliminates the hand-mixed batch tank, which is the single biggest source of maturation variance in older plants.
Two more dosing fixes pay back inside one quarter. First, replace constant-rate polymer pumps with flow-paced pumps linked to the sludge feed flowmeter; dose variance drops from ±30% to ±5% in most retrofits. Second, consolidate to a single point of injection. Split injection — common when operators add a second feed point to "help" — drives charge neutralization loss and 10-20% higher active demand because the floc is sheared after it forms. One well-placed injection port ahead of the dewatering device, with a static mixer if the line is short, outperforms two ports at the same total dose.
Reduce Polymer Load by Thickening and Equalizing Upstream
The cheapest pound of polymer saved is the one never dosed. Thickening waste activated sludge (WAS) from 0.8-1.2% solids to 3-5% solids roughly halves the active polymer required per dry ton processed, because the polymer now conditions less water and the feed to the dewatering device is more uniform. A DAF sludge thickener ahead of the dewatering device at 3-5% capture is a common industrial pattern and typically returns its polymer savings in 6-12 months.
Equalization improves consistency as much as thickening. WAS flows swing 2-3× across a shift, and the polymer dose has to follow. A 30,000-gallon sludge holding tank with overflow weirs and gentle mixing flattens the swing and lets the dose sit at the floor of the dose-response curve, not the peak. Equalization also reduces the volume of centrate or filtrate returned to the head of the plant, which lowers secondary BOD load and aeration demand — a 5-10% gain that compounds the polymer savings.
Build a Polymer Reduction Program and Track Cost per Dry Ton

The four levers above only save money if the savings are measured. Establish a baseline: dry tons per day, polymer feed rate, active content, cake solids, and capture efficiency, and report $/dry ton weekly. Set a 90-day target — typically a 20% reduction in lb active/dry ton with no more than a 2 percentage point drop in capture. Plants that hit both numbers without re-tuning equipment are rare; the goal is to find the real ceiling first, then defend it.
Re-run the jar matrix monthly for the first quarter, then quarterly, and re-verify active content on every shipment. Audit vendor invoices against the active-content data; on the first audit, 10-20% of polymer spend is typically recovered as a credit or future-shipment adjustment, because lot active content rarely matches the certificate of analysis (COA) exactly. For a worked example of how the $/dry ton KPI ties into a full plant budget, the wastewater treatment cost per cubic meter 2026 ROI breakdown walks through the line items. Related process context for municipal plants is in the municipal sewage sludge thickening and dewatering process guide.
Frequently Asked Questions
What is a normal polymer dose for a centrifuge dewatering biosolids?
A decanter centrifuge running 20-25% cake solids typically needs 10-20 lb active polymer per dry ton, with 12-15 lb as the common working range for aerobically digested biosolids. A dose persistently above 18 lb/ton usually indicates an upstream feed-solids problem or a bowl-speed/pond-depth mismatch, not a chemistry problem (HydropureWater field data, 2026).
How do I measure active polymer content at the plant?
Weigh 2-3 mL of neat liquid polymer into a pre-tared dish, dry at 105°C overnight, cool in a desiccator, and reweigh. Active content equals final mass divided by initial mass, multiplied by 100.
Frequently Asked Questions
How do I reduce polymer consumption in sludge dewatering?
Reducing polymer consumption requires optimizing the charge density and molecular weight of the polymer to match the specific sludge zeta potential. Implementing automated feed systems based on real-time solids loading, ensuring proper dilution water quality (pH 6–8, low hardness), and maintaining a precise maturation time of 30 to 60 minutes in the make-down unit can improve efficiency by 15% to 25%.
Additionally, performing regular bench-scale capillary suction time (CST) testing allows operators to identify the exact inflection point of flocculation, preventing overdosing that leads to high filtrate turbidity and increased reagent costs.
What is the typical polymer dose for a centrifuge versus a belt press?
Centrifuge applications typically require higher polymer dosages due to the high-shear environment, generally ranging from 5 to 15 kg of active polymer per dry tonne of solids. In contrast, belt filter presses utilize lower shear forces and gravity drainage, resulting in typical dosage requirements between 2 and 8 kg per dry tonne.
These ranges are highly dependent on sludge characteristics, such as the ratio of volatile suspended solids (VSS) to total suspended solids (TSS) and the specific surface area of the sludge particles.
How do I measure the active polymer content of an emulsion?
The most accurate method to determine the active polymer content in an emulsion is via the gravimetric analysis technique, where a sample is dried in a controlled oven at 105°C to evaporate the water and carrier oil, leaving behind the solid polymer residue. Alternatively, colloidal titration using a charge-neutralizing titrant like PVSK (potassium polyvinyl sulfate) can determine the ionic activity of the polymer solution.
Engineers should verify the concentration provided by the manufacturer against these laboratory methods, as variations in carrier oil content can lead to significant errors in mass balance calculations.
Why does my polymer dose keep creeping up month over month?
A gradual increase in polymer demand is often indicative of changing sludge characteristics, such as an increase in the proportion of secondary waste activated sludge (WAS) relative to primary sludge, which increases the required surface area for flocculation. It may also signal the degradation of polymer make-down equipment, such as fouled static mixers or inconsistent water pressure, which prevents the polymer from reaching its full hydrodynamic volume.
Furthermore, seasonal shifts in wastewater temperature affect the viscosity of the polymer and the settling velocity of the floc, often necessitating a recalibration of the dosing pump setpoints to maintain target cake dryness.
Can sludge thickening upstream reduce polymer use?
Yes, increasing the solids concentration of the feed sludge prior to the dewatering stage significantly reduces total polymer consumption. By utilizing gravity belt thickeners or rotary drum thickeners to raise feed solids from 1% to 3% or 4%, the volume of liquid requiring chemical conditioning is drastically reduced, lowering the overall mass of polymer required to achieve the same final cake dryness.
Higher feed solids also improve the hydraulic capacity of the dewatering unit and often result in better floc structure stability, which decreases the sensitivity of the process to fluctuations in polymer dosage.