Why Memphis Fabricated Metals Plants Are Re-evaluating CAS in 2026
Memphis-area fabricated metals plants discharge a wastewater profile that conventional activated sludge (CAS) was not originally designed to polish to reuse quality. Typical influent streams contain oil and grease from stamping and drawing fluids (often 30–200 mg/L peak), suspended solids from grinding and polishing booths, dissolved metals that frequently include hexavalent chromium and nickel from plating rinses, and intermittent cyanide-bearing streams that complicate any biological stage. Compliance with 40 CFR Part 433 metal-finishing categorical pretreatment limits sets the floor: oil and grease at 52 mg/L daily maximum, total suspended solids at 60 mg/L daily maximum, plus individual ceilings for copper (3.38 mg/L), lead (0.69 mg/L), nickel (3.98 mg/L), total chromium (2.77 mg/L), and zinc (2.61 mg/L) (per EPA 40 CFR Part 433). The local Memphis POTW pretreatment program layers on top: discharge permits, self-monitoring reports, and surcharges for exceedances that routinely push Mid-South finishers toward tighter on-site treatment and water reuse rather than continued reliance on sewer discharge.
Three 2026 pressures are forcing the re-evaluation. First, sewer surcharges in the Memphis metro have risen an estimated 8–14% year-on-year since 2024 as MLGW and the regional treatment authorities pass through capital and inflation costs. Second, Mid-South water scarcity, anchored in the 2024 Mississippi River alluvial aquifer drawdown reports, has made plant managers cautious about buying more city water for low-stakes rinses. Third, corporate ESG and zero-liquid-discharge targets now appear in most Tier-1 customer audits. The combined effect: a CAS basin that was adequate in 2018 is being asked to produce near-reuse effluent in 2026, which is exactly the gap a membrane bioreactor (MBR) is sized to close.
How MBR and CAS Actually Differ at the Process Level
CAS is a suspended-growth biological process in which biomass is separated from treated water by a secondary clarifier, with sludge return and wasting controlled to maintain a target mixed liquor suspended solids (MLSS) of roughly 2,000–4,000 mg/L. CAS performance is governed by settleability; bulking sludge, foaming, and hydraulic surges from oily rinse streams routinely push clarifiers past their solids loading limit and send TSS over the Part 433 ceiling.
An MBR replaces the secondary clarifier with a microfiltration or ultrafiltration membrane module, most commonly a 0.1 μm PVDF flat-sheet or a 0.02 μm PVDF hollow-fibre cassette immersed directly in the aeration tank. Because the membrane retains all biomass, the reactor can operate at much higher MLSS — typically 8,000–12,000 mg/L — and at longer solids retention times (SRT) of 20–60 days versus 5–15 days in CAS. The shorter hydraulic retention time (HRT) of 4–8 hours combined with the smaller aeration volume is what produces the up to 50% smaller footprint cited by PCI Membranes for the MBR configuration (PCI Membranes technical article, accessed 2026-01). MBR effluent is also free of suspended solids with reduced bacteria and viral content, so the permeate can be disinfected minimally and fed directly to a reverse osmosis (RO) polishing stage for closed-loop rinse reuse.
The PMC review on MBR fouling (Krzeminski et al., 2016, PMC4931528) consolidates the MBR advantages over CAS: higher volumetric loading rates, shorter HRT, longer SRT, less excess sludge production, and the potential for simultaneous nitrification/denitrification when the basin is zoned. The trade-offs the same review flags are equally real: MBR carries higher specific energy demand, requires active membrane fouling control through air-scour aeration and periodic chemical cleaning, and forces a planned 5–10 year membrane replacement budget that CAS simply does not have.
MBR vs CAS Parameter Comparison for Metals-Finishing Effluent
The table below puts the process numbers side by side so the engineer can judge whether the MBR upgrade is justified for a specific Memphis metals-finishing duty. Values are typical operating ranges for industrial MBRs treating oily metal-bearing wastewater; treat them as feasibility envelopes, not guaranteed bids.
| Parameter | Conventional Activated Sludge (CAS) | Membrane Bioreactor (MBR) |
|---|---|---|
| Footprint (aeration + separation) | Baseline; clarifier governs area | Up to 50% smaller vs CAS (PCI Membranes, 2026) |
| MLSS operating range | 2,000–4,000 mg/L | 8,000–12,000 mg/L (PMC review, 2016) |
| HRT | 6–24 h | 4–8 h (PMC review, 2016) |
| SRT | 5–15 days | 20–60 days (PMC review, 2016) |
| Effluent TSS | 10–30 mg/L typical; can spike on bulking | <1 mg/L; effectively TSS-free (per integrated MBR membrane bioreactor system spec) |
| Effluent BOD₅ / COD | 20–40 / 80–150 mg/L | <5 / <30 mg/L (PCI Membranes, 2026) |
| Oil & grease tolerance | Clarifier buffers short spikes | Membrane fouling rises sharply above ~50 mg/L feed O&G (PMC review, 2016) |
| Sludge yield | Higher; 0.4–0.6 kg TSS/kg BOD | Lower; long SRT reduces yield (PMC review, 2016) |
| Energy intensity | ~0.3–0.5 kWh/m³ aeration | ~0.5–1.1 kWh/m³ incl. membrane scouring (PCI, 2026) |
| Reuse-readiness | Needs UF or media polish before RO | RO-ready permeate; <1 μm, low turbidity (per DF-series flat-sheet PVDF membrane module) |
For Memphis metals finishers, the O&G tolerance row is the decisive cell. CAS can ride out a 2–4 hour oily spike because the clarifier buffers it; the same spike arrives at the MBR membrane surface and shows up as a transmembrane pressure (TMP) event within minutes.
Where MBR Wins: Footprint, Reuse, and Compliance Headroom
The footprint win is the first thing procurement notices on a constrained Memphis industrial site. Cutting the aeration-plus-separation envelope by roughly 50% and eliminating the secondary clarifier frees floor space that, in a typical Memphis job shop, is the difference between adding a third stamping cell or not. The HydropureWater integrated MBR membrane bioreactor system ships in 10–2,000 m³/day modules, so the same envelope scales from a 30-employee fabrication shop to a multi-line finisher without re-engineering the civils.
The reuse win is the financial case. MBR permeate at sub-1 μm and very low turbidity feeds an industrial RO polishing stage directly, producing rinse-quality water that displaces city-water purchase and cuts sewer discharge volumes in parallel. At Mid-South 2026 water-and-sewer blended rates of roughly $9–14 per 1,000 gallons (MLGW + Memphis POTW combined, per 2025-08 rate filings), a 50 m³/day reuse loop returns $160,000–$250,000 per year in avoided charges before any production-yield credit.
The compliance headroom is the regulatory case. MBR's effectively TSS-free effluent sits well below the 60 mg/L 40 CFR Part 433 daily maximum even on the worst mixed-sample day, and the long-SRT biology handles ammonia spikes from parts-washing surfactants that would push a CAS basin into nitrification upset. Membrane biology also tolerates the diurnal swings typical of a single-shift Memphis job shop, which CAS often does not.
Where CAS Still Wins: Oil Tolerance, CapEx, and Retrofit Simplicity
CAS is the right answer when the existing aeration basin and clarifier are already in place, discharge is to sewer rather than to reuse, and the influent O&G regularly exceeds ~50 mg/L. CAS can be upgraded with new diffusers, a redesigned waste-sludge line, and a DAF upstream for a fraction of MBR capex. The clarifier genuinely buffers short oily upsets that would otherwise translate into immediate MBR fouling events.
Quantitative fouling data makes the O&G point concrete. The PMC review reports that increasing biopolymer cluster (BPC) concentration in MBR mixed liquor by 20% raised the fouling rate by 120%, and a 60% increase raised it by 300% (Sun et al., as cited in PMC4931528, 2016). Stamping and drawing fluids are exactly the kind of feed that drives BPC and EPS concentrations up. Calcium hardness is the second decision variable: the same review notes that Ca²⁺ up to 280 mg/L can actually help flocculation, but above 800 mg/L it sharply raises inorganic scaling on the membrane surface. Memphis groundwater routinely sits at 100–180 mg/L as CaCO₃, so Ca²⁺ is manageable on the supply side but can climb inside the basin if rinse-water evaporative concentration is allowed to run unchecked.
The honest recommendation: put a DAF oil and grease pre-treatment unit ahead of any biological stage when O&G regularly exceeds ~50 mg/L. DAF drops O&G to under 20 mg/L, which both CAS and MBR can ride comfortably, and it protects the membrane investment in MBR designs.
Fouling, Cleaning, and Operating Cost Reality for MBR
The fouling pattern in a submerged MBR follows a recognizable three-stage TMP profile (PMC4931528, 2016). Stage 1 is an initial conditioning fouling caused by pore blocking and solute adsorption — typically the first 24–72 hours of operation on a new or freshly cleaned membrane. Stage 2 is a slow, roughly linear TMP rise as biofilm and cake build on the membrane surface, lasting weeks. Stage 3 is a sudden, steep TMP jump that forces an unscheduled clean if missed. The job of operations is to keep Stage 2 short and never let Stage 3 start.
Translated into a maintenance calendar: continuous air-scour aeration underneath the membrane cassettes, a weekly to monthly recovery clean (soak in 200–500 mg/L sodium hypochlorite), and a full clean-in-place (CIP) with both chlorine and citric acid every 6–12 months depending on feed. Membrane replacement is a planned 5–10 year lifecycle cost, not an emergency line item; PVDF flat-sheet cassettes from the DF-series flat-sheet PVDF membrane module family are rated for that service life under typical metals-finishing feed.
Energy runs higher than CAS. MBR scouring aeration adds 0.2–0.6 kWh/m³ on top of biological oxygen demand, partially offset by smaller blowers and the elimination of clarifier scraping drives. For a Memphis plant targeting reuse, this operating-cost premium is typically recovered in 3–5 years through reduced water purchase and sewer discharge alone; the avoided capex on a new clarifier and the avoided surcharges shorten that payback further.
Retrofit vs Greenfield: A Memphis Decision Framework
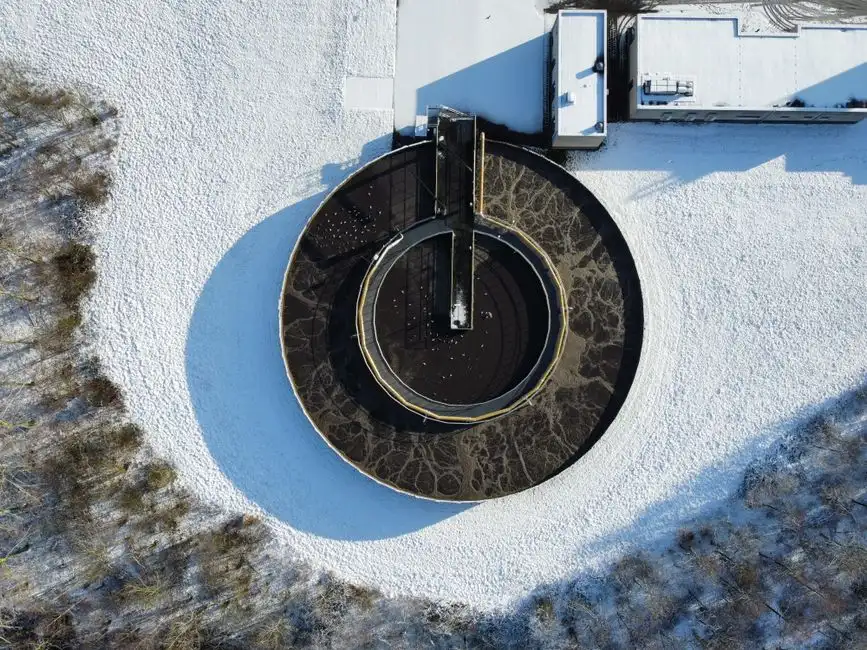
Hand this matrix to procurement. Score 1 point per "yes" on the four questions below. A score of 3–4 favors a full MBR retrofit; 1–2 favors a CAS-plus-UF hybrid; 0 favors keeping the existing CAS basin and investing the budget in DAF and equalization instead.
| Decision Question | Yes → | No → |
|---|---|---|
| 1. Is the existing CAS clarifier undersized, failing, or near its solids-loading limit? | Counts toward MBR retrofit | Reuse the existing asset |
| 2. Is site footprint constrained for additional production capacity? | MBR's 50% footprint win is decisive | Footprint is not a driver |
| 3. Is rinse-water reuse a current or near-term (≤3 yr) goal? | MBR permeate is RO-ready | CAS suffices for sewer discharge |
| 4. Is influent O&G consistently < ~50 mg/L with adequate equalization? | MBR is biologically feasible | Add DAF first; defer MBR |
For plants that score 1–2, a hybrid path often closes the gap at half the capex: keep the existing CAS basin, add a UF stage for TSS polishing when reuse or stricter discharge limits arrive, and only later convert to full MBR when the UF cassettes are due for replacement. Comparable retrofit logic for Erie fabricators is detailed in the Erie fabricated metals MBR vs CAS guide, and the Longview Texas angle in the Longview fabricated metals MBR vs CAS guide shows how the same matrix swings when influent O&G is the dominant variable.
Before committing to a full retrofit, run a 4–8 week on-site pilot with a single DF-series cassette and a jar-test program for Ca²⁺ and oil partitioning. Validate against the BPC and Ca²⁺ thresholds cited above, confirm TMP behaviour on the actual feed, and use the pilot data to lock in the 10-year lifecycle cost — not just the capex line item — when the decision lands in front of the CFO. The final choice should be defended against 40 CFR Part 433 compliance, the local Memphis POTW pretreatment program, and the 10-year cost of water plus sewer plus surcharges, not against the installed-equipment number alone.
Frequently Asked Questions
Is MBR or CAS better for oily fabricated metals wastewater in Memphis?
CAS handles oily spikes better because the secondary clarifier buffers short upsets, but MBR produces lower TSS, lower BOD, and reuse-ready permeate. For influent O&G consistently below ~50 mg/L with DAF upstream, MBR is the stronger long-term choice for reuse and 40 CFR Part 433 compliance.
How much footprint does an MBR save versus CAS on a metals-finishing line?
An MBR delivers up to 50% smaller footprint than a comparable CAS system by eliminating the secondary clarifier and operating at 8,000–12,000 mg/L MLSS in a smaller aeration tank (PCI Membranes technical article, 2026).
What is the compliance path for 40 CFR Part 433 metal-finishing limits with an MBR?
MBR permeate typically runs <1 mg/L TSS and <5 mg/L BOD₅, well below the Part 433 daily maxima of 60 mg/L TSS and 52 mg/L oil and grease, giving wide safety margin for copper, nickel, lead, chromium, and zinc when upstream precipitation is properly operated.
How often do MBR membranes need replacement on metals-finishing duty?
PVDF flat-sheet or hollow-fibre MBR membranes typically carry a 5–10 year service life under industrial metals-finishing feed, with routine CIP every 6–12 months; replacement is a planned lifecycle cost, not an emergency event.
Can an MBR feed a reverse osmosis system directly for rinse-water reuse?
Yes. MBR permeate at sub-1 μm and very low turbidity feeds an RO polishing stage directly without intermediate media filtration, which is the standard configuration for closed-loop rinse reuse in industrial water recycling (PCI Membranes, 2026).