
Why Petroleum Wastewater in Vansant Pushes Conventional Activated Sludge to Its Limits
Raw wastewater at small Appalachian refineries or tank farms in or near Vansant, VA, typically arrives at the biological stage with COD 500–2,500 mg/L, oil & grease 100–1,000 mg/L, phenols 20–200 mg/L, BTEX 1–50 mg/L, sulfide 5–100 mg/L, and total nitrogen 40–120 mg/L. When produced water is blended in, TDS and TSS swing unpredictably, and dissolved salt can climb above 5,000 mg/L (HydropureWater field data, 2026). Conventional activated sludge (CAS) at 3,000–5,000 mg/L MLSS and 5–15 day SRT handles moderate refinery loads but struggles with biomass washout of slow-growing phenol and BTEX degraders, floc blanketing when O&G slugs coat the mixed liquor, and clarifier failure when bulking coincides with high FOG. The clarifier is the weak link; it cannot distinguish between well-flocculated biomass and oily emulsions, causing effluent solids and residual oil to rise together.
Buchanan County hosts small refineries, terminals, and tank farms discharging in the 50–500 m³/day range, often on ridgeline pads with limited buildable area. These sites must satisfy Virginia Pollutant Discharge Elimination System (VPDES) limits, including the 2024 Total Nitrogen and Total Phosphorus effluent revisions under 9 VAC 25-31, and the Oil & Gas Extraction category where applicable. The operator must determine if CAS delivers compliant effluent reliably given the influent, available footprint, and site labor constraints.
MBR vs Conventional Activated Sludge: A Parameter-by-Parameter Technical Comparison
MBR systems maintain 8,000–20,000 mg/L MLSS at a 30–60 day SRT, retaining biomass on a 0.1 μm PVDF flat-sheet or 0.02–0.04 μm UF membrane (per IntechOpen Membrane Operations reference) to decouple SRT from HRT. This separation ensures that hydraulic shocks do not wash out slow-growing degraders. CAS relies on gravity settling in a clarifier at 3,000–5,000 mg/L MLSS and 5–15 day SRT, where high-flow batches from an upstream tank farm can strip nitrifiers in hours. MBR effluent typically measures TSS <5 mg/L, turbidity <1 NTU, and O&G <5 mg/L when DAF pretreatment is in place; CAS effluent typically lands at TSS 10–30 mg/L, turbidity 5–15 NTU, and O&G 10–15 mg/L without a polishing step. MBR eliminates the secondary clarifier and most RAS pumping, requiring roughly 60% less plot area than CAS—a 100 m³/day train needs about 60 m² as MBR versus 150 m² for CAS plus its clarifier (HydropureWater system reference, 2026).
| Parameter | MBR (submerged PVDF) | Conventional Activated Sludge (CAS) |
|---|---|---|
| MLSS | 8,000–20,000 mg/L | 3,000–5,000 mg/L |
| SRT | 30–60 days | 5–15 days |
| HRT | 6–12 h (decoupled from SRT) | 8–24 h (coupled to SRT) |
| F/M ratio | 0.05–0.15 kg BOD/kg MLSS·d | 0.2–0.5 kg BOD/kg MLSS·d |
| Observed sludge yield | 0.2–0.4 kg TSS/kg COD removed | 0.4–0.6 kg TSS/kg COD removed |
| Solid–liquid separation | 0.1 μm PVDF flat-sheet or 0.02–0.04 μm UF membrane | Gravity clarifier; limited by floc integrity |
| Effluent TSS | <5 mg/L | 10–30 mg/L |
| Effluent turbidity | <1 NTU | 5–15 NTU |
| Effluent O&G (post-DAF) | <5 mg/L | 10–15 mg/L (often higher; polishing usually required) |
| Footprint at 100 m³/day | ~60 m² | ~150 m² (incl. clarifier) |
| Microplastic removal (Lares et al., 2018) | ~0.4 MP/L in effluent | ~1 MP/L in effluent |
Produced-water blending and polymer flocculants introduce microplastics into refinery wastewater, and the same membrane that retains biomass also captures particles that CAS cannot stop.
Where MBR Loses to CAS: Energy, Membrane Fouling, and Operating Cost Reality
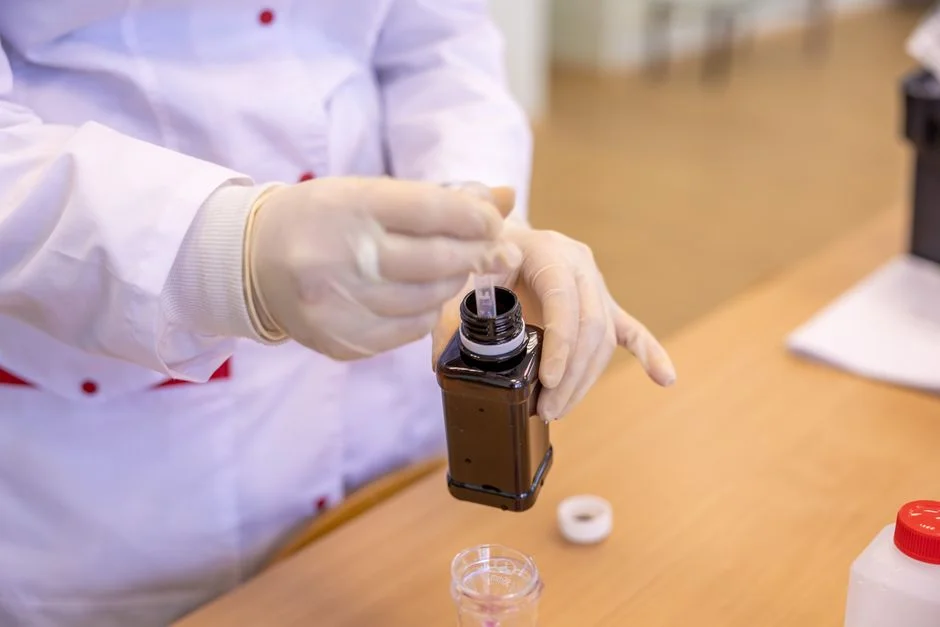
MBR aeration provides oxygen for biology and coarse-bubble scour across the membrane surface, resulting in higher specific air demand per cubic metre of permeate than CAS. Submerged flat-sheet configurations such as the DF series flat-sheet MBR membrane modules report 10–20× lower energy than external cross-flow designs by eliminating high-flow recirculation pumps, yet the MBR still carries an irreducible aeration penalty. Three fouling modes dominate petroleum duty: biofouling from extracellular polymer, scaling when hardness and sulfide interact, and O&G blinding when free oil reaches the membrane. The mitigation toolkit includes relaxation cycles, backwash, chemically enhanced backwash (CEB), and clean-in-place (CIP) with NaOCl for organic fouling and citric acid for scale. O&G blinding is the primary failure mode in refinery service when DAF pretreatment is skipped or under-sized.
Mannina et al. modeled direct GHG emissions at 0.85 kgCO2eq/m³ for CAS versus 0.91 kgCO2eq/m³ for MBR, with the 7% increase for MBR attributable to membrane aeration. Karim & Mark (2017) found MBR becomes the lower total-cost option only after very long amortization (more than 67 years) when superior effluent value is captured. For most Vansant-scale projects, the decision rests on footprint, reuse economics, and compliance margin rather than raw OPEX. Procurement should expect 10–20% higher OPEX for MBR due to membrane replacement, CEB chemicals, and additional aeration kWh. An integrated MBR system that bundles membranes, blowers, and controls on a single skid helps close that gap through factory optimization.
Pretreatment Is Not Optional: Why Every MBR or CAS Train for Petroleum Needs DAF First
The process flow that functions in petroleum field applications is: oil/water separator (API or CPI) → dissolved air flotation system → equalization → biological (MBR or CAS) → polishing (sand filter, UF, or RO). DAF is the non-negotiable step. Micro-bubble flotation drops free oil below 50 mg/L and strips suspended solids, colloidal FOG, and heavy metals bound to particulates before the stream reaches the biological stage. The DAF family covers 4–300 m³/h across 13 standard models with automatic skimming and skid mounting, matching the 50–500 m³/day flow window typical of Vansant-area terminals.
Without DAF, an MBR will foul rapidly on free oil, blinding the membrane within days. Similarly, a CAS basin suffers chronic bulking and loss of nitrification without DAF. This pretreatment step is the deciding factor in whether the biological stage succeeds or fails, as municipal-focused MBR comparisons often overlook the specific challenges of petroleum O&G loads.
Vansant, Virginia in 2026: Permit Drivers, Climate, and Site Constraints That Tip the Choice
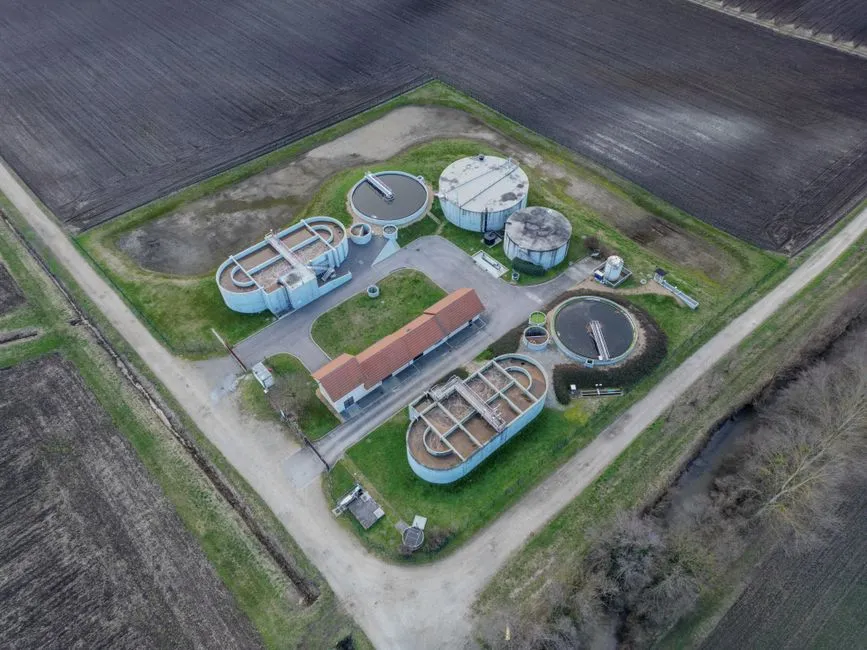
Two regulatory and physical realities push Vansant-area projects toward MBR. First, the 2024 VPDES TN/TP amendments tightened nitrogen and phosphorus limits, making MBR an attractive option for 50–500 m³/day flows because the long SRT supports nitrification and the compact basin allows for an anoxic zone without expanding the footprint. Second, Appalachian sites face rising interest in industrial reuse for cooling-tower makeup, dust suppression on coal-handling pads, and boiler feed. MBR effluent at <1 NTU feeds RO directly, whereas CAS effluent at 5–15 NTU typically requires UF pre-polishing.
Climate also influences the choice. Vansant winters regularly push basin temperatures below 10 °C, the threshold where open CAS basins lose nitrification capacity. Submerged MBR enclosures and covered tanks retain biological heat to maintain mesophilic activity through cold snaps. Plot geometry serves as the final tiebreaker: many Buchanan County tank farms sit on narrow ridgeline pads where a 60% footprint reduction dictates project feasibility.
A 3-Step Selection Framework: Choose MBR or CAS for Your Vansant Petroleum Site
- Plot and reuse. If footprint is constrained or treated water will be reused (cooling, dust control, RO feed), shortlist MBR. If there is room and discharge-to-stream is acceptable, CAS remains a defensible choice.
- Influent severity. If phenols run above 50 mg/L, BTEX is detectable, or O&G spikes above 500 mg/L are routine, MBR's high-MLSS, long-SRT biology outperforms CAS. If influent is moderate and well equalized, CAS is sufficient.
- Operator model. MBR requires membrane CIP discipline and a module-replacement line item (renewal every 5–8 years). CAS requires ongoing clarifier and bulking-control attention. Match the system to the operator skill set available on site.
Both paths share the same DAF pretreatment and equalization requirements. For related waste streams, the MBR vs activated sludge comparison for high-BOD FOG food and beverage wastewater and the MBR vs CAS footprint comparison for pharmaceutical wastewater apply similar logic to different influent envelopes. For OPEX benchmarking, the 2026 municipal wastewater OPEX breakdown provides a useful cost-structure reference.
Frequently Asked Questions
Can MBR handle the oil and grease in refinery wastewater?
Yes, when DAF pretreatment drops free oil below approximately 50 mg/L upstream and the PVDF membrane is rated for hydrocarbon exposure. The MBR itself cannot tolerate free oil; the upstream oil/water separator and DAF remove the bulk of the contaminants, while the membrane retains the residual emulsified fraction and biomass.
Is MBR worth the higher CAPEX for a small petroleum site in Vansant?
Usually yes, when footprint, reuse, or stringent TN/TP limits drive the design. The OPEX gap is roughly 10–20% in additional energy and membrane maintenance per the Mannina et al. plant-wide model, while CAPEX premiums are recovered through plot savings, reuse revenue, and compliance margin against the 2024 VPDES TN/TP revisions.
How often do MBR membranes need cleaning in petroleum duty?
Typically a chemically enhanced backwash every 1–2 weeks and a full CIP every 3–6 months, depending on influent O&G control upstream. Sites that operate DAF within specification routinely extend CIP intervals, while sites that skip or under-size DAF find themselves cleaning membranes weekly.
Can conventional activated sludge meet Virginia VPDES oil and grease limits?
Yes, but only with reliable oil/water separation and DAF upstream, plus a polishing step (sand filter or UF) to consistently reach <15 mg/L O&G and low TSS. Without polishing, CAS effluent often sits at 10–15 mg/L O&G with high variability.