What Drives a Municipal WWTP Operating Budget in 2026
Municipal wastewater plant operating costs in 2026 typically total $0.30–$1.20 per m³ treated, broken into six major buckets: electricity (30–50%, the largest single line), labor (20–30%), sludge handling and disposal (15–25%), chemicals (5–15%), maintenance and parts (5–10%), and laboratory plus administration (3–7%). Energy alone runs 0.3–1.0 kWh/m³ depending on technology — making aeration efficiency, blower VFD retrofits, and process selection the highest-leverage cost controls a municipal operator can deploy. For a 50,000 m³/day plant, that range translates to an annual OPEX envelope of roughly $5.5M–$22M before debt service — a figure that fits on one slide of a council budget presentation.
The percentage split is not a constant. Small plants under 5 MLD routinely run at $0.80–$2.00/m³ because minimum shift staffing, lab compliance, and per-unit chemical handling push labor and admin overhead above 40% of total spend. At the other end, a well-instrumented 100+ MLD plant with a $0.06/kWh tariff can sit near the bottom of the band, near $0.32/m³. Norway's national statistics agency reported that 85.7% of the population was connected to municipal wastewater facilities in 2024, up only marginally from 85.5% in 2019 — a useful reminder that most OECD infrastructure is now mature and the OPEX battleground has shifted from build-out to operational efficiency (Statistics Norway, published 2025-10-24).
The reason every operator's bucket mix looks different is that four variables drive it simultaneously: plant size, treatment level (secondary vs tertiary vs reuse), regional energy tariff, and the share of biosolids going to landfill versus land application. A 20 MLD plant in a high-tariff jurisdiction discharging to a sensitive receiving water can easily run 60% energy and 20% sludge; the same plant in a low-tariff region with agricultural biosolids reuse can flip to 25% energy and 12% sludge. Treat the ranges below as a defensible envelope, not a fixed budget line. For a parallel breakdown calibrated to industrial flows, see the industrial wastewater plant operating cost breakdown 2026.
| Cost Bucket | % of Total OPEX | Typical $/m³ Range | Primary Cost Lever |
|---|---|---|---|
| Electricity | 30–50% | $0.024–$0.140 | Aeration blower VFDs, DO control |
| Labor | 20–30% | $0.06–$0.25 | Automation, shift consolidation |
| Sludge handling & disposal | 15–25% | $0.05–$0.30 | Dewatering dry solids, contract competition |
| Chemicals | 5–15% | $0.02–$0.12 | Polymer dose optimization, jar testing |
| Maintenance & parts | 5–10% | $0.015–$0.12 | Predictive vs preventive split |
| Lab, monitoring & admin | 3–7% | $0.01–$0.08 | Parameter list rationalization |
Electricity: The 30–50% Line Item
Aeration blowers consume 50–60% of total plant electricity in conventional activated sludge, with secondary clarifiers, return/waste activated sludge pumps, and ultraviolet or chlorination disinfection taking most of the remainder. That single number — 50–60% of the bill inside the largest line item — explains why energy is the only OPEX category where double-digit percent reductions are routinely available without cutting service. The typical 2026 kWh/m³ envelope runs 0.3–0.6 for CAS, 0.5–0.8 for sequencing batch reactors, and 0.6–1.0 for MBR (HydropureWater field data, 2026; consistent with USEPA Energy Star WWTP benchmarks for secondary treatment).
Translated to a dollar figure at an industrial tariff of $0.08–$0.14/kWh, electricity alone runs $0.024–$0.140/m³ — and that range alone spans the entire chemical line item. A plant at the high end of both ranges (MBR, $0.14/kWh) is paying 5.8× more for energy than a plant at the low end (CAS, $0.08/kWh) for the same cubic meter treated. This is the gap a finance committee will ask about, and the answer is almost always aeration.
Three cost-control levers, in priority order: First, retrofit fixed-speed positive-displacement blowers with VFD-driven high-efficiency turbo blowers — published case studies consistently show 20–35% energy reduction on aeration with 2–4 year paybacks at $0.10+/kWh tariffs. Second, install dissolved-oxygen-based aeration control with seasonal setpoint adjustment; 10–25% aeration energy savings are achievable without harming nitrification completeness. Third, evaluate a process redesign toward lower-loaded biology (extended aeration, MLE, or MBR) where it reduces the total air required per kg BOD removed. The MBR integrated wastewater treatment system packaged train is one option for sites where the OPEX delta versus CAS is acceptable in exchange for reuse-grade effluent and a 50–60% smaller footprint.
Labor, Maintenance, and the Fixed-Cost Floor
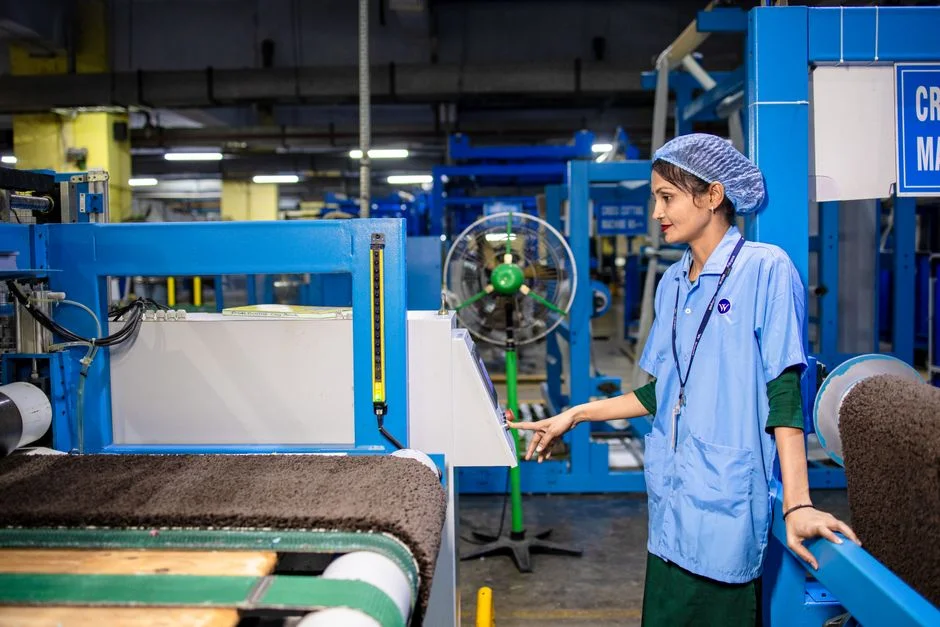
Labor OPEX runs $0.06–$0.25/m³ for plants in the 5–50 MLD band, and it is the cost category with the steepest economy-of-scale curve. Small plants carry disproportionately high labor cost per m³ because minimum shift staffing — typically three operators per shift for a 24/7 operation — must be maintained regardless of flow. A 2 MLD plant with 9 FTE shifts and a $60,000 fully loaded labor rate is paying roughly $0.82/m³ for labor alone before a single kilowatt is consumed. A 50 MLD plant with the same staffing model pays $0.03/m³ — a 27× difference that explains why packaged and underground systems exist.
The industry rule of thumb for staffing intensity is 1 FTE per 1,500–3,000 m³/day for CAS plants with conventional SCADA, dropping to 1 FTE per 4,000–6,000 m³/day for fully automated MBR or submerged aerated filter packages. The gap is automation, not operator skill. Maintenance OPEX splits roughly 60–75% routine preventive, 15–25% spare parts, and 10–15% major overhaul reserve — and a plant that underfunds the overhaul line inevitably pays 3–5× the avoided cost in emergency rebuilds.
For small-flow satellite sites under 1 MLD that cannot justify three-shift coverage, the WSZ underground package sewage treatment plant removes the 24/7 staffing overhead by running unattended with periodic remote monitoring — typically cutting the labor line for those sites by 50–70%.
Chemicals, Sludge Disposal, and Lab Monitoring
Chemical OPEX runs $0.02–$0.12/m³ across most municipal plants and is dominated by three line items: coagulant (polyaluminum chloride or aluminum sulfate at $0.005–$0.04/m³), polymer flocculant for sludge dewatering ($0.01–$0.06/m³), and supplemental carbon — methanol or acetate — for denitrification when influent BOD is insufficient ($0.01–$0.05/m³). Polymer dose optimization via routine jar testing is the single most repeatable 10–20% chemical saving available; the automatic chemical dosing system makes the optimization persistent by holding dose proportional to real-time solids loading rather than operator-set constant feed.
Sludge disposal OPEX is the line item most exposed to year-over-year inflation. Transport plus landfill tipping in most OECD markets runs $50–$250 per dry ton, which means each 1% improvement in dewatering dry solids content pays back disproportionately — a cake going from 22% to 24% DS cuts hauled tonnage by 8.3% with zero chemistry change. The plate and frame filter press typically delivers 24–28% DS versus 18–20% for a belt press, and pairs with the high-efficiency sedimentation tank upstream to thicken sludge before the press, reducing polymer demand and extending filter cloth life. Lab and compliance monitoring runs $0.01–$0.05/m³ and is the hidden growth line — expanding effluent parameter lists under EU, China, and India regulatory revisions are quietly adding 15–30% to monitoring cost year over year in jurisdictions with strict emerging-contaminant programs.
OPEX Comparison: CAS vs SBR vs MBR for the Same Plant
The single most useful artifact for a budget defense is a side-by-side per-m³ OPEX comparison across the three most common municipal process trains at the same design flow. The table below assumes a 20 MLD plant, secondary effluent to a non-sensitive receiving water, industrial tariff of $0.10/kWh, and 2026 European/North American pricing for chemicals, polymer, and sludge disposal.
| Parameter | CAS (Conventional Activated Sludge) | SBR (Sequencing Batch Reactor) | MBR (Membrane Bioreactor) |
|---|---|---|---|
| Total OPEX ($/m³) | $0.30–$0.60 | $0.35–$0.70 | $0.45–$1.00 |
| Electricity (kWh/m³) | 0.3–0.6 | 0.5–0.8 | 0.6–1.0 |
| Electricity ($/m³ at $0.10/kWh) | $0.03–$0.06 | $0.05–$0.08 | $0.06–$0.10 |
| Membrane / media replacement | N/A | Decanter maintenance only | $0.02–$0.06/m³ (lifecycle) |
| Footprint (m² per m³/day) | 0.4–0.7 | 0.25–0.45 | 0.15–0.25 |
| Tertiary filtration required for reuse | Yes (+$0.05–$0.15/m³) | Yes (+$0.05–$0.15/m³) | No — effluent already reuse-grade |
| SCADA / automation complexity | Low–medium | High (batch sequencing) | Medium–high |
| Best fit | Land available, low energy tariff | Variable influent, modest flows | Land-constrained, reuse mandate |
The honest read: MBR OPEX premium is typically 10–25% over CAS at the same site, but the avoided tertiary filtration ($0.05–$0.15/m³) and 60% smaller footprint often offset the premium at sites with land constraints or reuse obligations. For membrane lifecycle planning on the MBR column, the standalone membrane replacement cost optimization reference covers the 5-year reserve methodology. The MBR membrane bioreactor module is the replaceable unit at the center of that lifecycle cost.
A 7-Step OPEX Reduction Playbook for 2026
- Submeter the plant by process unit. Most municipal WWTPs do not know their kWh/m³ by aeration tank, return sludge, or disinfection, and approximately 60% of energy audits never start without a submetering plan in place. A $40,000–$80,000 submetering rollout is the prerequisite for every other step on this list.
- Replace fixed-speed blowers with VFD-driven turbo blowers on aeration. Typical payback 2–4 years at $0.10+/kWh, with 20–35% energy reduction on the largest electrical load in the plant.
- Tune aeration DO setpoints to seasonal loading. Dropping from 2.0 mg/L to 1.5 mg/L setpoint during cold months saves 10–25% aeration energy without harming nitrification; the savings are larger in summer when oxygen transfer is already efficient.
- Optimize polymer dose to sludge dewatering via routine jar testing. 10–20% polymer reduction is achievable in most plants; paired with better dewatering equipment, the sludge line often drops 15% net.
- Compete the sludge disposal contract. Tipping fee variance across haulers routinely exceeds 30% within a single region. For a 20 MLD plant producing 8 dry tons/day, a 30% tipping fee reduction is worth $90,000–$220,000 per year.
- Adopt a 5-year membrane replacement reserve for MBR sites. Emergency membrane replacement typically costs 15–25% more than planned replacement; the budget reserve is the cheapest insurance available. For the dryer side, see the sludge dryer maintenance cost 2026 reference.
- Deploy packaged or underground systems like WSZ at satellite small-flow sites to remove 24/7 staffing overhead. The labor saving on a 200 m³/day satellite site typically exceeds the entire OPEX of the equipment within 3 years.
Frequently Asked Questions
What is the average operating cost per m³ for a municipal WWTP in 2026? $0.30–$1.20/m³ depending on plant size, treatment level, and energy tariff. Small plants under 5 MLD skew toward the upper end ($0.80–$2.00/m³) due to labor and compliance overhead per unit flow; large plants at low tariffs can sit at the lower end.
What percentage of WWTP OPEX is electricity? 30–50% globally, and 40–60% in high-energy-tariff regions. Aeration blowers alone account for 50–60% of that electricity figure.
How much does sludge disposal cost a municipal WWTP? $50–$250 per dry ton for transport and tipping, representing 15–25% of total OPEX. Each 1% improvement in dewatering dry solids content reduces hauled tonnage by roughly 0.5–0.8%.
Is MBR more expensive to operate than conventional activated sludge? 10–25% higher $/m³ at the same site, partially offset by avoided tertiary filtration ($0.05–$0.15/m³). Net premium is typically 0–10% when reuse-grade effluent is required.
What is the biggest controllable cost in a wastewater treatment plant? Aeration electricity, addressable through VFD-driven turbo blowers, dissolved-oxygen-based control, and seasonal setpoint tuning. Together those three measures can cut the plant's largest line item by 30–50%.