
Why Hammond Petroleum Wastewater Puts Both MBR and CAS Under Pressure
Petroleum bulk-storage terminals, refineries, and trans-load operations along the Hammond, Indiana corridor generate wastewater that municipal comparisons simply do not cover. Flow is intermittent, temperatures swing from 5°C in winter to 40°C in summer, and the influent is dominated by free and emulsified oil & grease (typically 200–2,000 mg/L), phenols (often 20–200 mg/L), benzene/toluene/ethylbenzene/xylene (BTEX) in the 5–50 mg/L range, and sulfides from tank-water draws (HydropureWater field data, 2026). Salinity tracks Lake Michigan turnover and salt-storage runoff, pushing conductivity to 2,000–5,000 µS/cm during spring events.
Indiana Department of Environmental Management (IDEM) and U.S. EPA Region 5 pretreatment standards cap the things refinery buyers actually get judged on: oil & grease at 100 mg/L for discharge to a POTW and 10–15 mg/L for direct surface-water discharge under 327 IAC 5-10, total recoverable petroleum hydrocarbons (TRPH) below 5 mg/L for many local limits, benzene below the 0.05–0.12 mg/L surface-water threshold, and BOD₅ typically 25–30 mg/L (per EPA 40 CFR 133 and IDEM industrial pretreatment guidance, 2026). A treatment train that meets these numbers during a normal week but trips during a slug of crude-bearing rainwater is not compliant.
For conventional activated sludge, the failure modes are well known: filamentous bulking from oil-coated floc, rising sludge in secondary clarifiers when temperature drops, and loss of nitrification during slug events. For a membrane bioreactor (MBR), the failure mode is different and less forgiving — emulsified oil droplets 1–10 µm in diameter blind the 0.04–0.2 µm membrane pores, raising transmembrane pressure (TMP) until flux collapses. Both technologies are stressed by Hammond wastewater, but in opposite ways, which is why the technology choice has to be made for the right reasons.
Reuse pressure is also a 2026 reality. Hammond industrial parks and the BP/Equastar corridor are evaluating closed-loop cooling-tower and boiler-feed make-up reuse, and that elevates the treatment target from "meet discharge limits" to "produce RO- or cooling-tower-quality feed on a consistent basis."
How MBR and Conventional Activated Sludge Treat Petroleum Wastewater Differently
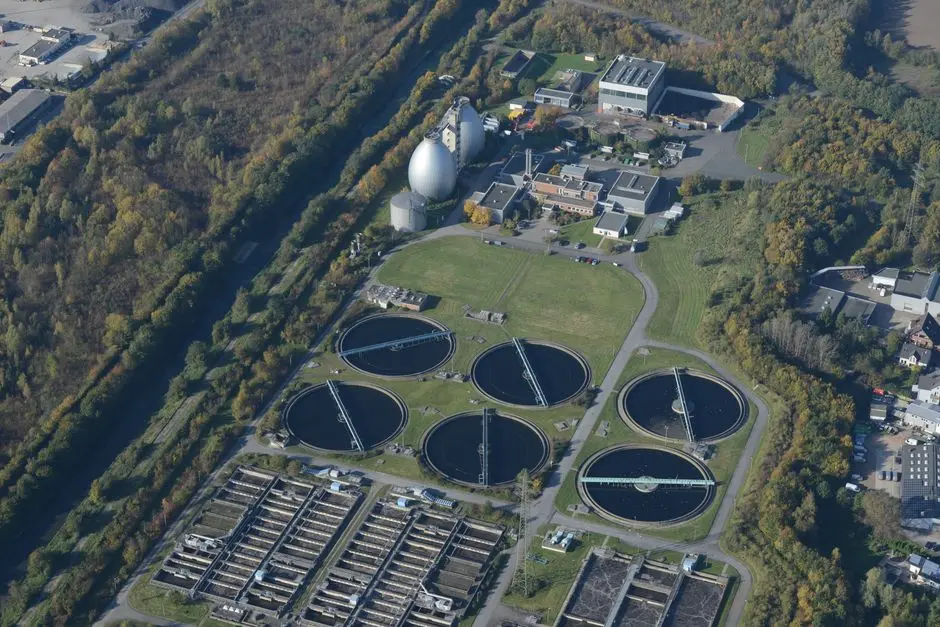
Conventional activated sludge (CAS) is a two-stage biological and physical process: an aeration tank where bacteria oxidize dissolved organics, followed by a secondary clarifier where biomass settles out under gravity and clarified water overflows to disinfection or further treatment. The clarifier is the weak point — any oil-coated floc, gas bubbles, or temperature inversion either pins to the surface or washes over the weir, sending TSS and residual oil into the effluent.
A membrane bioreactor keeps the same biological reactor but replaces the clarifier with a submerged microfiltration or ultrafiltration membrane module, typically with pore sizes between 0.04 and 0.2 µm (S4). Because the membrane physically retains all biomass and most suspended solids, MBR can operate at mixed-liquor suspended solids (MLSS) of 8,000–12,000 mg/L versus 2,000–4,000 mg/L in CAS, and at sludge retention times (SRT) of 20–60 days versus 5–15 days. The longer SRT is decisive for refinery duty: slower-growing organisms that degrade phenols, BTEX, and other recalcitrant petroleum hydrocarbons get retained in the reactor instead of being wasted. The 0.04–0.2 µm barrier also delivers a near-sterile effluent with log-reduction values (LRV) of 3.0 to >6.7 for bacteria and viruses, compared to 1.5–4.2 for CAS with secondary settling (S2) — a margin that matters when the plant is trying to meet a reuse permit in 2026.
The trade-off is fouling. Coarse-bubble aeration below the membranes, periodic relaxation cycles, and clean-in-place (CIP) with sodium hypochlorite and citric acid are mandatory. These fouling-mitigation steps are the reason MBR energy demand typically runs 2–5× higher per m³ than CAS (S3). The membranes also need replacement on a 5–8-year cycle depending on feed quality and CIP discipline. The full mechanism, including the flat-sheet PVDF geometry used in refinery duty, is laid out in the MBR Effluent Quality & Working Principle: 2026 Engineering Specs, Removal Rates & Zero-Risk Selection Guide and the MBR Wastewater Treatment System Working Principle: 2026 Engineering Specs, Process Flow & Zero-Risk Selection Guide.
Side-by-Side Performance on Petroleum Effluent Parameters
The table below consolidates peer-reviewed CAS-versus-MBR data (S2, S3) with refinery-relevant parameters drawn from HydropureWater field data on petroleum bulk-storage and refining duty (2026). All values are typical operating ranges for refinery or terminal wastewater after primary oil/water separation.
| Parameter | CAS (conventional activated sludge) | MBR (membrane bioreactor) |
|---|---|---|
| COD removal | 85–93% | 93–98% |
| BOD₅ removal | 90–96% | 96–99% |
| Oil & grease in effluent | 10–25 mg/L (with good primary separation) | <5 mg/L — membrane retains emulsified droplets the clarifier cannot |
| TSS in effluent | 10–30 mg/L | <1 mg/L |
| Ammonia (nitrification) | Complete at SRT >10 d at 20°C; partial below 10°C | Complete at SRT 20–60 d even at 8–10°C |
| Typical HRT | 6–12 h | 4–8 h |
| Typical SRT | 5–15 d | 20–60 d |
| MLSS range | 2,000–4,000 mg/L | 8,000–12,000 mg/L |
| Footprint factor (same load) | 1.0× (baseline) | 0.4–0.6× |
| Microplastics in effluent (S3, Lares et al. 2018) | ~1.0 MP/L | ~0.4 MP/L |
| Bacteria / virus LRV (S2) | 1.5–4.2 | 3.0 to >6.7 |
| Direct GHG emissions (S3) | 0.85 kgCO₂eq/m³ | 0.91 kgCO₂eq/m³ |
| Reuse suitability (cooling-tower/boiler) | Requires tertiary filtration + disinfection | Typically RO-pretreatment-ready as-is |
The O&G row is where MBR earns its keep on petroleum duty. A CAS clarifier can only settle droplets large enough to overcome upflow velocity; emulsified oil in the 1–10 µm range passes through and shows up as a sheen on the effluent launder. A 0.04–0.2 µm MF/UF membrane physically blocks those droplets, so MBR effluent O&G is consistently below 5 mg/L without tertiary polishing. That single number drives most of the 2026 refinery selection in Northwest Indiana. The HydropureWater integrated MBR system is built around this advantage, and the DF series PVDF flat-sheet MBR modules are the replaceable element.
Footprint, Energy, and 10-Year OPEX for a Hammond Refinery WWTP
MBR footprint is typically 40–60% smaller than CAS for the same BOD load, with the HydropureWater integrated MBR system rated at 60% smaller than a conventional train of equivalent capacity (S6). On a Hammond tank-farm parcel where every square meter is allocated to containment or load rack, that footprint delta is often the binding constraint. Energy demand runs 2–5× higher per m³ than CAS due to membrane scouring aeration and CIP duty (S3).
The order-of-magnitude cost ranges below are anchored to the HydropureWater MBR catalog sizing of 10–2,000 m³/day (S6) and scaled for three Hammond refinery flow tiers. CAPEX includes civil, tankage, membranes, blowers, and instrumentation; OPEX includes power, chemicals, sludge hauling, and membrane replacement amortized over a 10-year horizon. A dissolved air flotation system is included as upstream oil removal in both trains, since neither technology tolerates raw O&G above ~100 mg/L.
| Cost item | 100 m³/day — CAS + DAF | 100 m³/day — MBR + DAF | 500 m³/day — CAS + DAF | 500 m³/day — MBR + DAF | 1,000 m³/day — CAS + DAF | 1,000 m³/day — MBR + DAF |
|---|---|---|---|---|---|---|
| CAPEX (installed, USD) | $350K–$500K | $550K–$750K | $1.4M–$1.9M | $2.0M–$2.7M | $2.6M–$3.5M | $3.8M–$5.0M |
| Annual OPEX (USD/yr) | $70K–$100K | $110K–$150K | $320K–$420K | $480K–$620K | $600K–$800K | $900K–$1.15M |
| Membrane replacement (every 5–8 yr) | N/A | $30K–$50K | N/A | $120K–$180K | N/A | $220K–$320K |
| Chemicals (CIP, coagulant, polymer) | $8K/yr | $18K/yr | $30K/yr | $70K/yr | $55K/yr | $130K/yr |
| 10-year lifecycle OPEX (USD) | $0.8M–$1.1M | $1.3M–$1.7M | $3.4M–$4.4M | $5.1M–$6.5M | $6.3M–$8.4M | $9.4M–$12.0M |
The MBR premium is real, but it is partially offset by what the CAS train still has to buy: a tertiary sand filter or disc filter to meet TSS limits, polymer for the clarifier, and a separate disinfection step before reuse. A refinery that values reuse credits at $1.50–$3.00 per m³ of produced water closes much of the OPEX gap inside 5–7 years. The sizing exercise is laid out in detail in the MBR Wastewater Treatment System Working Principle: 2026 Engineering Specs, Process Flow & Zero-Risk Selection Guide.
Pretreatment, Slug Control, and Membrane Protection for MBR at Oil Sites
An MBR that receives raw refinery wastewater will fail in weeks. The upstream train is non-negotiable. A dissolved air flotation system or a corrugated plate interceptor (CPI) drops free oil & grease below 50–100 mg/L and protects the membrane tank from bulk-oil shock. The selection logic between DAF and CPI for oily wastewater is covered in the DAF vs API Separator for Pharmaceutical Oily Wastewater (2026) article and applies to refinery duty with minor changes in polymer dose.
Equalization, pH control to 6.5–8.0, and nitrogen/phosphorus balancing are equally important. Refinery wastewater is often carbon-rich and nutrient-starved, so a typical dosing target is BOD:N:P of 100:5:1 to keep biomass metabolizing BTEX and phenols rather than going into endogenous decay. Temperature moderation in the equalization tank keeps the reactor above 10°C during Northwest Indiana winters; below that, nitrification slows regardless of technology.
For the membrane stage itself, flat-sheet PVDF modules are preferred for refinery duty. The geometry tolerates the coarse-bubble scouring needed to keep oil-fouled surfaces clean, and individual elements can be replaced without pulling the whole cassette — the DF series PVDF flat-sheet MBR modules are designed around that maintenance case. The full HydropureWater integrated MBR system packages the bioreactor, membrane cassette, blowers, and CIP skid into a single skid for refinery tie-ins. Expect CIP every 6–12 weeks on a properly pretreated feed; without DAF upstream, that interval collapses to days.
Which to Choose in 2026: MBR or CAS for a Hammond Petroleum Site
The decision reduces to four variables: flow rate, available footprint, oil & grease load variability, and whether reuse is on the project scope.
Choose MBR when the Hammond site targets reuse, faces tight oil & grease or TRPH limits under IDEM and EPA Region 5, has limited land (typical for legacy tank-farm parcels), or needs to handle high and variable MLSS. The 20–60 day SRT and 0.04–0.2 µm physical barrier deliver the consistent effluent quality that IDEM reviewers in 2026 expect, especially for surface-water discharge or reuse permits. MBR also wins for flows above 200 m³/day where the footprint delta is most economically valuable.
Choose CAS when flow is under ~100 m³/day, oil slugs are managed in equalization, reuse is not on the project scope, and the buyer prioritizes lowest first-cost and simplest operations. CAS has no membrane to replace, no CIP chemicals, and a process-control philosophy that any qualified operator can run. For a satellite bulk-storage terminal with a basic NPDES permit and no reuse obligation, CAS remains defensible.
Recommended hybrid: DAF + MBR for Hammond bulk-storage terminals above 200 m³/day, paired with the integrated MBR system and the DAF as the upstream workhorse. For lower-flow satellite facilities, DAF + CAS + sand filter remains the cost-effective default. Either way, the permit posture drives the choice more than the technology preference — IDEM and EPA Region 5 reviewers will read a 60% smaller footprint and a <5 mg/L O&G guarantee as evidence of a defensible design.
Frequently Asked Questions
What oil & grease concentration can an MBR tolerate in petroleum wastewater?
With a DAF or CPI upstream dropping free oil to 50–100 mg/L, an MBR with PVDF flat-sheet membranes routinely delivers <5 mg/L O&G in effluent. Raw O&G above 200 mg/L without pretreatment will foul the 0.04–0.2 µm membrane pores within hours and is not a sustainable operating point.
Why does CAS bulking happen on refinery wastewater, and how is it avoided?
Filamentous bacteria thrive on the long-chain hydrocarbons and low dissolved-oxygen pockets created when oil coats activated-sludge floc. The result is poor settling, high sludge volume index (SVI > 200 mL/g), and TSS washout over the clarifier weir. Mitigation is a selector zone, chlorination of return activated sludge, and consistent oil removal upstream — but the most reliable fix on petroleum duty is to switch to MBR, where settling is irrelevant.
What is the realistic membrane life and replacement cost for a refinery-duty MBR?
PVDF flat-sheet membranes on properly pretreated refinery feed last 5–8 years before flux decline forces replacement. Replacement cost runs roughly 30–35% of original membrane CAPEX, which for a 500 m³/day train in the $120K–$180K range per change-out (HydropureWater field data, 2026). Skipping DAF pretreatment cuts membrane life to 1–3 years and eliminates the cost benefit of MBR.
What are the IDEM and EPA Region 5 oil & grease and TRPH limits for petroleum wastewater discharge?
IDEM pretreatment standards (327 IAC 5-10) cap oil & grease at 100 mg/L for discharge to a POTW and 10–15 mg/L for direct surface-water discharge; total recoverable petroleum hydrocarbons (TRPH) is typically limited to 5 mg/L locally, and benzene to 0.05–0.12 mg/L (per EPA 40 CFR 133 and IDEM industrial pretreatment guidance, 2026).
How much smaller is an MBR footprint than a CAS system for the same refinery load?
An MBR train occupies roughly 40–60% of the footprint of an equivalent CAS train at the same BOD load, with the HydropureWater integrated MBR system rated at 60% smaller than conventional (S6). The savings come from higher MLSS, no clarifier, and the elimination of most tertiary filtration.