Why Mount Joy Food & Beverage Plants Are Rethinking CAS
At 02:40 on a Sunday, the clarifier at a Mount Joy dairy co-packer lost its sludge blanket. A CIP (clean-in-place) acid rinse had dropped the aeration basin to pH 4.2 for ninety minutes, filamentous organisms bloomed, and TSS (total suspended solids) carryover pushed the effluent above 180 mg/L for six hours — a number that, depending on the receiving stream, can sit on the wrong side of a PA DEP Chapter 91 effluent limit. The plant manager's Monday call was the one we hear most often from Lancaster County operators: "How many more of these can we absorb before we retrofit?"
Mount Joy sits inside a food and beverage cluster where dairy, snack, prepared-food, and beverage-bottling lines run in parallel, and where a single shared treatment plant often sees the combined wastewater envelope of all of them. That envelope is brutal for gravity-based separation: BOD (biochemical oxygen demand) 1,000–10,000 mg/L, FOG (fats, oils, and grease) 200–1,500 mg/L, pH 4–11 excursions from CIP acid and caustic cycles, and flow surges of 2–5× base load during cleaning campaigns (per Complete Filtration, 2024). Conventional activated sludge relies on a clarifier to settle biomass, and clarifiers fail in predictable ways under that envelope — FOG blinds the floc, low pH collapses nitrification, and high flow lifts the sludge blanket into the launder.
What changes the math for a Mount Joy plant is the receiving-water context. Discharges into the Susquehanna watershed carry Chesapeake Bay TMDL (Total Maximum Daily Load) pressure for nitrogen and phosphorus, and PA DEP Chapter 91 NPDES (National Pollutant Discharge Elimination System) permits set site-specific effluent limits for BOD, TSS, ammonia, and oil & grease. Each permit cycle tends to tighten. When a clarifier already carries over twice a year, the retrofit case for a submerged MBR (membrane bioreactor) is no longer about innovation — it is about avoiding the next near-miss. For a deeper side-by-side on footprint and FOG performance, see the MBR vs activated sludge footprint guide for FOG wastewater.
How Each System Actually Works in a Food & Beverage Plant
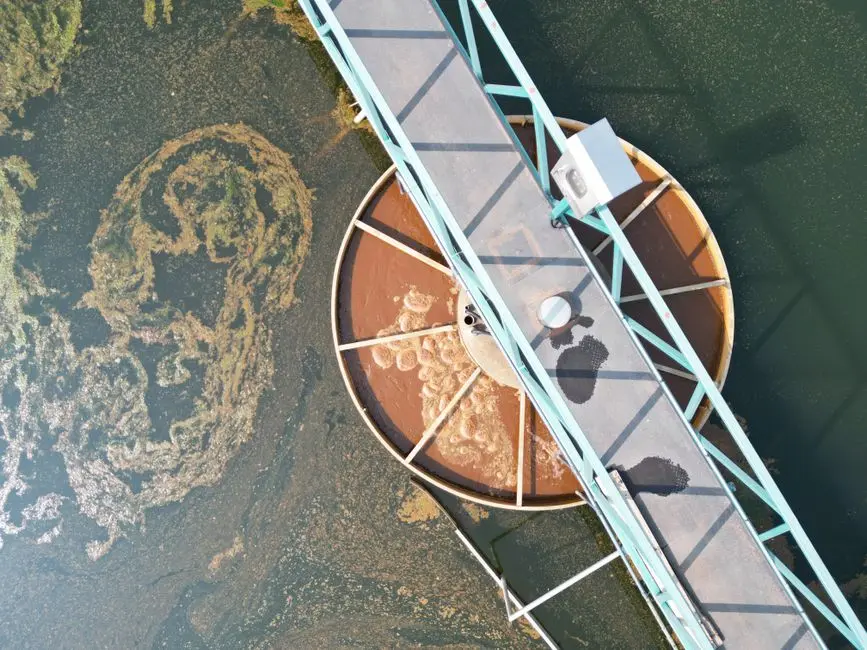
A conventional activated sludge (CAS) system is two unit operations in series: an aerobic basin where bacteria biodegrade organics, and a gravity clarifier where the mixed liquor settles and clarified water overflows to disinfection. In a dairy or snack plant, the clarifier is the weak link — FOG coats the floc, pH swings kill the nitrifiers, and the blanket rises during peak flow. The biology is forgiving; the settler is not.
A membrane bioreactor (MBR) keeps the same aerobic biology but replaces the clarifier with a submerged PVDF (polyvinylidene fluoride) ultrafiltration membrane, typically 0.1 μm nominal pore size. Because the membrane is a physical barrier rather than a gravity separator, 100% of the biomass stays in the reactor. That single change raises mixed liquor suspended solids (MLSS) from 2,000–4,000 mg/L in CAS to 8,000–12,000 mg/L in MBR, which compresses the aeration basin footprint by roughly 60% (per Mannina et al., 2019) and extends solids retention time (SRT) enough to biodegrade the slowly-degradable fraction that survives a short-SRT CAS plant. The trade-off is real: submerged membranes foul, so the system needs continuous aeration scour, periodic backwash, and chemical cleaning with NaOCl (sodium hypochlorite) and citric acid. That is the source of the 5–15% OPEX (operating expenditure) premium over CAS and the reason a HydropureWater integrated MBR system is sized with a maintenance envelope around every cassette.
F&B Wastewater Characteristics That Drive the Technology Choice
The technology decision is really a wastewater-characterization decision. A Mount Joy plant manager should be able to drop their own influent numbers into the envelope below and see which system survives.
| Parameter | Typical F&B Range | CAS Clarifier Risk | MBR Tolerance |
|---|---|---|---|
| BOD | 1,000–10,000 mg/L | Sludge washout at peak load | Handled by extended SRT |
| COD (chemical oxygen demand) | 2,000–20,000 mg/L | Effluent COD 80–250 mg/L | Effluent COD typically <50 mg/L |
| TSS | 500–5,000 mg/L | Carryover during hydraulic surge | Physical barrier, <5 mg/L effluent |
| FOG | 200–1,500 mg/L | Floc blinding, rising sludge | No settling required; FOG biodegraded |
| pH | 4–11 excursions | Nitrifier collapse <6.0 or >9.0 | Biomass retained, recovery faster |
| Temperature | 20–45°C | Poor settling at high T | Membrane unaffected by T |
| CIP surge ratio | 2–5× base flow | Sludge blanket lift | Hydraulic capacity set by membrane flux |
The failure modes on the third column are the ones plant managers actually call about. FOG blinding of floc and pH-driven nitrification collapse are the two most common triggers for a Mount Joy retrofit evaluation. MBR does not eliminate the biology problem — nitrifiers still die at pH 4 — but the membrane holds the dead biomass in the basin so the population recovers in hours rather than days, and the effluent stays under permit while it does. Lares et al. (2018) also reported MBR effluent microplastics at 0.4 MP/L (microplastics per litre) versus 1 MP/L for CAS, a useful data point for snack and beverage plants with plastic packaging washdown sending fragments to the drain. Where FOG is the dominant loading, a HydropureWater DAF pre-treatment upstream of the MBR is the standard Mount Joy configuration.
Head-to-Head: MBR vs CAS on the Metrics That Matter
This is the table a plant manager screenshots and forwards to procurement. Every row is a decision.
| Parameter | CAS (Conventional Activated Sludge) | MBR (Submerged PVDF, e.g. DF Series) |
|---|---|---|
| Effluent COD | 85–95% removal; 50–200 mg/L | 95–99% removal; typically <50 mg/L, often <30 mg/L |
| Effluent TSS | 10–30 mg/L, carryover risk during peaks | <5 mg/L (physical membrane barrier) |
| Effluent NH₃-N (ammonia nitrogen) | 1–5 mg/L at stable SRT; fails during pH crash | <1 mg/L at extended SRT; faster recovery |
| MLSS | 2,000–4,000 mg/L | 8,000–12,000 mg/L |
| SRT | 5–15 days | 20–60 days |
| Footprint | Baseline (large clarifier + aeration) | ~60% smaller (no clarifier, higher MLSS) |
| FOG tolerance | Low — floc blinding | High — no settling required |
| pH tolerance | Nitrification collapses outside 6.5–8.5 | Wider envelope; biomass retained during excursions |
| Reuse suitability | Requires tertiary polish (DAF/sand/UF) | Often direct to RO or CIP reuse |
| Direct GHG (greenhouse gas) | 0.85 kgCO₂eq/m³ | 0.91 kgCO₂eq/m³ |
| Energy demand | 0.2–0.5 kWh/m³ | 0.3–0.8 kWh/m³ |
| OPEX premium vs CAS | — | +5–15% (membrane aeration + CIP chemicals) |
| Membrane life | N/A | 5–10 years; replacement $15–50/m² |
The MLSS row is the engineering reason for the footprint row, and the footprint row is the engineering reason for the reuse row. Higher biomass in a smaller basin produces effluent clean enough to feed an RO (reverse osmosis) unit or a CIP loop, which is where the brownfield retrofit payback actually lives. The energy and GHG deltas are real but small — MBR is roughly 0.1–0.3 kWh/m³ higher and 0.06 kgCO₂eq/m³ higher, both driven by membrane scour aeration (per Mannina et al., 2019). For Mount Joy plants that already pay for DAF and sand filtration ahead of RO, the relevant comparison is CAS + DAF + sand + RO pretreatment versus MBR alone into RO — and the second stack usually wins on both footprint and OPEX. The membrane module reference for the MBR column is the DF series flat sheet membrane modules (80–225 m² units).
Retrofit Economics: CAPEX, OPEX, and Mount Joy Payback Reality
Karim and Mark (2017) reported that MBR is the best option when the planning horizon exceeds 67 years in a greenfield build, because the CAPEX (capital expenditure) gap is amortized over decades of superior effluent. That number circulates in academic comparisons and scares CFOs. It does not describe a brownfield food and beverage retrofit, where the math is fundamentally different.
In a Mount Joy brownfield retrofit, the existing aeration basin stays, the failing clarifier is decommissioned, and a submerged MBR cassette drops into the existing tankage. The CAPEX line items are: membrane modules (DF series 80–225 m² units, skid-mounted), a blower upgrade sized for membrane scouring aeration, PLC (programmable logic controller) integration with the existing SCADA (supervisory control and data acquisition), and a chemical cleaning system. OPEX line items unique to MBR are membrane replacement every 5–10 years, NaOCl and citric acid for periodic CIP, and roughly 0.1–0.3 kWh/m³ of additional aeration energy. The line items a brownfield retrofit avoids are the new clarifier, the DAF, the sand filter, and any tertiary polish an equivalent CAS scheme would need to meet the same PA DEP effluent numbers — and that avoided CAPEX is what closes the MBR gap.
| Line Item | CAS + DAF + Sand (Greenfield-Equivalent) | MBR Retrofit (Brownfield) |
|---|---|---|
| New clarifier | Yes | No (decommissioned) |
| DAF unit | Yes (FOG polish) | Optional upstream only |
| Sand/multimedia filter | Yes (tertiary TSS) | No (membrane replaces it) |
| Membrane modules | No | Yes (DF series cassettes) |
| Blower upgrade | Minor | Yes (membrane scour) |
| 5-year membrane replacement reserve | $0 | $15–50/m² amortized |
| Indicative payback vs status quo | — | 4–8 years (F&B brownfield) |
| Planning horizon (Karim & Mark 2017) | 67 years to break even greenfield | Not applicable — brownfield is term-limited by asset life |
The 4–8 year payback band comes from three Mount Joy-specific drivers: (1) avoided CAPEX on tertiary polish that the MBR effluent makes redundant, (2) avoided surcharges and consent-order risk from clarifier carryover events, and (3) water-reuse credit when MBR effluent feeds the CIP loop instead of fresh utility water. For a plant that is already feeding RO, see the parallel analysis in our UF vs DAF RO pretreatment for F&B process water guide.
PA DEP and Local Compliance: What Mount Joy Plants Must Clear
PA DEP Chapter 91 governs surface and industrial discharge permits in Pennsylvania, and the NPDES program layers on site-specific effluent limits for BOD, TSS, ammonia, oil & grease, and (for surface discharges) nutrients. Lancaster County plants sit inside the Chesapeake Bay watershed, which adds TMDL pressure on total nitrogen and total phosphorus that the EPA's Bay model allocates state-by-state and PA DEP passes through to individual permits. Each permit renewal tends to tighten, particularly for ammonia and phosphorus, and the burden of proof is on the discharger.
For a Mount Joy plant, the practical compliance test is: can your clarifier effluent meet the next permit cycle's limits during a CIP peak? MBR effluent typically meets direct-discharge or sewer-discharge limits for BOD, TSS, and ammonia without tertiary polish, and the longer SRT (20–60 days versus 5–15 for CAS) gives the biology enough residence time to nitrify reliably and to support a biological phosphorus removal stage when paired with chemical polishing. CAS effluent more often needs a downstream DAF, sand filter, or cloth media filter to clear the same bar — and each of those adds footprint, OPEX, and a new failure mode. Combined-sewer and separate-sewer service areas in Mount Joy carry different local limits; the framework is consistent, but the numbers are site-specific and need to be pulled from the current permit.
When CAS Still Wins — and When MBR Is the Right Answer
CAS is not the wrong answer everywhere. A small bottling line with stable flow, BOD under 1,500 mg/L, and a clarifier with margin is cheaper to run as CAS than as MBR. The OPEX delta of 5–15% matters most when the influent is well-behaved and the discharge limits are not pressing. If the existing clarifier settles cleanly, the sludge blanket is stable, and the plant has land to expand, the right move is usually to stay with CAS and tighten the upstream screening.
MBR is the right answer when the existing CAS is hitting effluent limits during CIP peaks, when footprint is constrained (which is most Mount Joy parcels inside the industrial corridor), when reuse for CIP or boiler feed is on the roadmap, or when a PA DEP permit renewal is forcing a discharge-quality upgrade. The hybrid path — keep the existing aeration basin, decommission the clarifier, drop a submerged MBR cassette into the existing tankage — is the most common Mount Joy brownfield approach, and it is what the HydropureWater integrated MBR system is sized for. The decision rule that consistently lands in retrofit territory: if your clarifier carries over TSS more than twice a year during peak loading, the avoided surcharge and consent-order risk have already paid for the MBR. For dairy-specific design parameters, our MBR configuration for dairy whey reuse and discharge guide extends the comparison.
Frequently Asked Questions
What effluent quality can a Mount Joy food plant expect from an MBR retrofit?
A submerged PVDF MBR (0.1 μm pore size) typically delivers effluent COD under 50 mg/L, TSS under 5 mg/L, and ammonia under 1 mg/L at SRT 20–60 days. That envelope meets PA DEP Chapter 91 NPDES discharge limits for most food and beverage permit cycles without tertiary filtration.
How does MBR footprint compare to CAS for a 1,000 m³/day dairy or snack plant?
MBR operates at MLSS 8,000–12,000 mg/L versus 2,000–4,000 mg/L for CAS, which compresses the aeration basin and eliminates the clarifier. Typical brownfield footprint reduction is 50–60%, so a 1,000 m³/day MBR skid often fits inside the existing aeration tankage with the clarifier decommissioned.
What is the realistic payback for an MBR retrofit in a Lancaster County food plant?
Brownfield MBR retrofits in F&B typically reach payback in 4–8 years, not the 67-year horizon cited for greenfield builds. The drivers are avoided CAPEX on tertiary polish (DAF, sand filter), avoided permit surcharges from clarifier carryover events, and water-reuse credit when MBR effluent feeds the CIP loop.
How often do MBR membranes need replacement, and what is the cost?
PVDF flat sheet membranes in food and beverage service typically last 5–10 years with proper chemical cleaning (NaOCl and citric acid CIP) and aeration scour. Replacement costs are commonly $15–50 per square metre of membrane area, depending on module size and specification (HydropureWater DF series reference).
Can a Mount Joy plant keep its existing aeration basin and just add an MBR cassette?
Yes. The standard brownfield retrofit retains the existing aerobic basin, decomissions the clarifier, and installs a submerged MBR cassette (DF series 80–225 m² units) into the existing tankage. Blower capacity usually needs an upgrade for membrane scouring aeration, and PLC integration is typical.