Why Fort Worth plastics and rubber plants are revisiting CAS vs MBR in 2026
For Fort Worth plastics and rubber plants, MBR outperforms conventional activated sludge on effluent TSS, residual microplastics, and footprint — typically 60% smaller and ~0.4 vs 1.0 MP/L in the permeate — but costs more in energy and membrane maintenance. CAS still wins on lowest OPEX when discharge limits are moderate and the existing aeration basin has years of life left. The right choice depends on TCEQ TPDES limits, water-reuse targets, and available plot area.
The pain points are concrete and easily visible on the daily self-monitoring report. A typical injection-molding, extrusion, rubber-compounding, or polymer-recycling facility in North Central Texas sends an influent to its CAS train that swings hard: TSS between 200 and 1,200 mg/L from polymer fines and rubber crumb, intermittent COD spikes to 3,500 mg/L when polymerization washwater dumps hit the equalization basin, oil and grease up to 400 mg/L from mold-release agents, and temperature excursions of 25–45 °C that walk activated-sludge flocs right up to the edge of bulking. A clarifier simply cannot hold the sub-50 μm polymer particles that ride the surface of the mixed liquor, and those fines are exactly the size that show up in TCEQ's residual-microplastics language and trigger TSS excursion notices (per TCEQ TPDES framework updates, 2026). The first line of defense is still a GX series rotary mechanical bar screen for gross solids, but the question on every 2026 planning spreadsheet is whether the next capital dollar goes into upgrading the existing CAS train or into a submerged MBR cassette that replaces the clarifier outright.
Plastics and rubber wastewater characteristics that change the MBR vs CAS calculation
Generic academic CAS/MBR comparisons are usually built on municipal data and miss the polymers-specific behaviors that determine whether the retrofit pays back. The table below summarizes a typical Fort Worth plastics/rubber influent — values are conservative engineering ranges drawn from field surveys of injection-molding, extrusion, and rubber-compounding facilities, not municipal data.
| Parameter | Typical Range | Implication for CAS vs MBR |
|---|---|---|
| COD | 800–3,500 mg/L | Pushes CAS F/M ratio; MBR handles at high MLSS |
| BOD | 400–1,800 mg/L | Recalcitrant fraction (plasticizers, antioxidants) needs long SRT |
| TSS | 200–1,200 mg/L | Polymer fines <50 μm overflow clarifier; MBR retains them |
| Oil & grease | 50–400 mg/L | Needs DAF pretreatment before either train |
| pH | 5.5–9.5 | Wide swings; MBR's biomass retention buffers shocks |
| Temperature | 25–45 °C | Stresses floc-settling in CAS; MBR is decoupled from settling |
| Residual monomers / stabilizers | Variable, trace | Slow-growing nitrifiers required for amine catalysts; MBR SRT 20–60 d supports them |
The high SRT window of an MBR — commonly 20–60 days versus 5–15 days for CAS — is the decisive lever here (Mannina et al., 2020). At 30+ days SRT, slow-growing nitrifiers colonize the reactor and oxidize amine catalyst residues, while the extended residence time lets heterotrophs mineralize plasticizers and phenol-type antioxidants that a 7-day CAS SRT simply does not degrade. The same study shows MBRs produce less waste activated sludge per kg COD removed because of the low observed cell yield at high SRT, which matters when polymer fines inflate sludge volume and your dissolved air flotation system is already pulling its weight on FOG. Temperature and pH swings still shock flocs in either system, but the MBR's complete biomass retention buffers the reactor in a way a clarifier-dependent CAS train cannot match — the clarifier is what fails first, not the biology.
How an MBR actually solves the plastics-line failure modes a CAS cannot
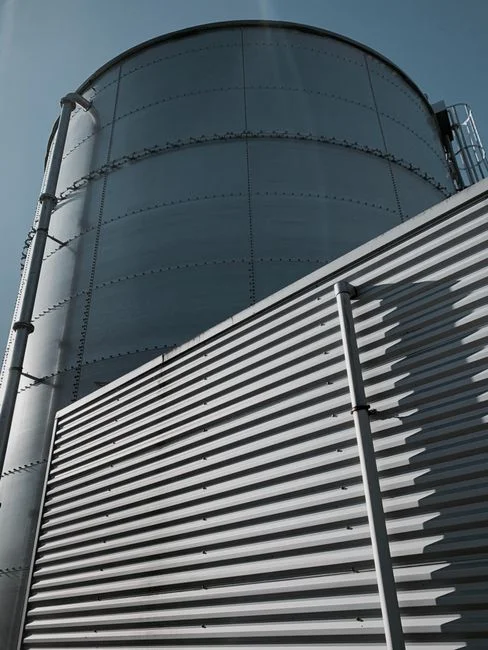
Define MBR plainly: it is an activated-sludge process coupled with a submerged PVDF ultrafiltration module (typically 0.03–0.1 μm pore size) that replaces the secondary clarifier and most of the solids-handling downstream of it (Mannina et al., 2020). On the supplier side, an integrated MBR membrane bioreactor system built around DF series PVDF flat sheet membrane modules with a 0.1 μm cutoff delivers sub-1 μm effluent quality in a single step (per HydropureWater product spec, 2026).
The four mechanistic advantages the academic literature credits to MBR — higher SRT, low cell yield, physical solid/liquid barrier, and significant footprint reduction (Mannina et al., 2020) — map directly onto the plastics-line pain points. The physical barrier is the one plant engineers notice first: a clarifier relies on floc settling velocity, and a 20 μm polymer fiber or a 40 μm rubber crumb simply does not settle in a 2.5 m/h overflow rate. A 0.1 μm membrane retains it, period. The footprint reduction (~60% versus an equivalent CAS train with clarifier and sludge recycle, per HydropureWater product spec, 2026) is the second thing a Fort Worth site engineer notices, especially near the Trinity River industrial corridor where plot area is constrained.
The honest part: the membrane aeration demand, the recovery cleanings (CIP) every 6–12 months, and the ~10–20% higher specific energy demand versus CAS (Mannina et al., 2020) are real OPEX lines. Budget them in. The literature is also clear that direct GHG emissions differ only slightly between well-operated systems — 0.91 kgCO2eq/m3 for MBR versus 0.85 kgCO2eq/m3 for CAS in the Mannina et al. benchmark (2020) — so do not oversell carbon as a decision driver.
Head-to-head: MBR vs CAS for plastics and rubber wastewater
The table below is the version a procurement counterpart will actually read. Values are drawn from Mannina et al. (2020), the HydropureWater MBR product spec (2026), Karim & Mark (2017) on long-term cost amortization, and Bertanza et al. (2017) on full-scale OPEX economics.
| Metric | CAS (well-operated) | Submerged MBR (PVDF) | Source |
|---|---|---|---|
| Effluent TSS | 10–30 mg/L | <1 mg/L (often <5 mg/L reported) | Mannina et al., 2020 |
| Effluent COD | 40–80 mg/L | 20–40 mg/L | Mannina et al., 2020 |
| Effluent oil & grease | 5–15 mg/L (post-DAF) | <2 mg/L (post-DAF) | Engineering range |
| Microplastics in permeate | ~1.0 MP/L | ~0.4 MP/L | Lares et al., 2018 (via Mannina et al., 2020) |
| Footprint | Baseline | ~60% smaller | HydropureWater product spec, 2026 |
| SRT | 5–15 d | 20–60 d | Mannina et al., 2020 |
| Sludge yield (kg DS/kg COD) | 0.30–0.40 | 0.20–0.30 | Mannina et al., 2020 |
| Direct GHG | 0.85 kgCO2eq/m3 | 0.91 kgCO2eq/m3 | Mannina et al., 2020 |
| Specific energy demand | Baseline | +10–20% | Mannina et al., 2020 |
| OPEX (10-yr, full-scale) | Lower | Higher | Bertanza et al., 2017 |
| Long-term optimum (amortized) | Shorter horizons | MBR wins beyond ~67 yr by effluent quality | Karim & Mark, 2017 |
| Retrofit feasibility on existing CAS | n/a | High (cassette fits in repurposed basin) | Engineering practice |
Two things to underline. First, the microplastics number — 0.4 MP/L MBR versus 1.0 MP/L CAS (Lares et al., 2018, as cited in Mannina et al., 2020) — is the plastics-industry-specific tiebreaker. No clarifier upgrade, no DAF polish step, no sand-filter add-on matches an absolute 0.1 μm membrane cutoff on fines and rubber crumb. Second, the long-run framing matters: Karim & Mark (2017) found MBR is the long-term optimum (more than 67 years) because the initial capex premium is amortized by sustained effluent quality, while Bertanza et al. (2017) showed CAS wins on pure OPEX over realistic 10–20 year plant horizons. A CAPEX memo for a 2026 retrofit should sit closer to the Bertanza side and treat the Lares et al. microplastics number as the differentiator, not the carbon number.
Decision framework: when CAS still wins in a Fort Worth plastics plant
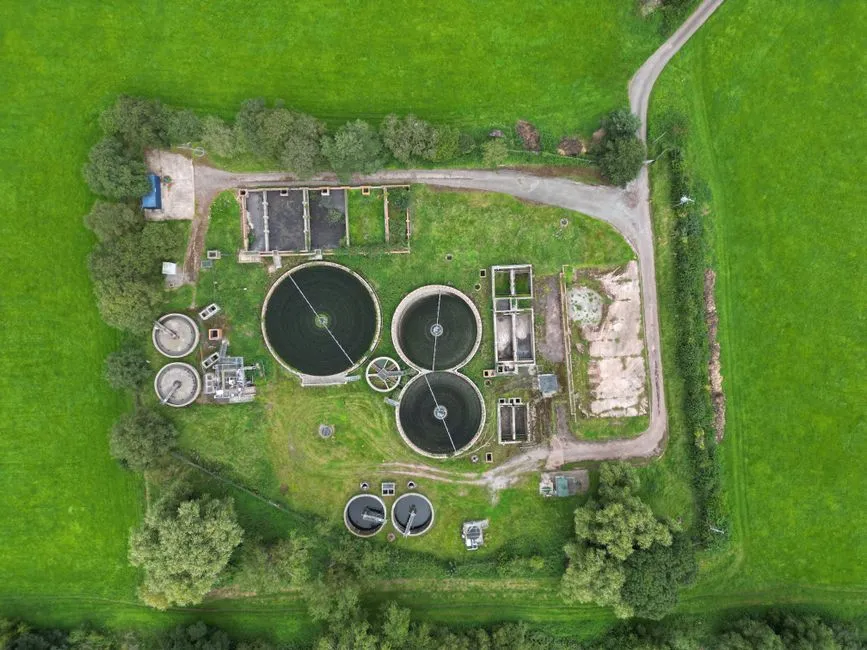
CAS is still the right answer when all of the following hold: the existing aeration basin has at least 8–10 years of structural life, TCEQ TPDES effluent limits on the permit are moderate (TSS >30 mg/L monthly average is acceptable), there is no water-reuse target, plot area is not constrained, and the influent microplastic load sits below the ~1.0 MP/L CAS benchmark from Lares et al. (2018). In that envelope, the lowest first-cost retrofit on a tight 2026 capex window is usually CAS with a dissolved air flotation system ahead of it to strip FOG and float off rubber crumb that a clarifier alone cannot catch, plus a high-efficiency sedimentation tank polish step if TSS excursions are the specific concern. Bertanza et al. (2017) provide the economic backing: full-scale CAS plants beat MBR on operating cost over realistic planning horizons. If a permit re-issue or a downstream cooling-tower reuse project is not on the 5-year roadmap, the CAPEX case for an MBR cassette is hard to defend to procurement.
Decision framework: when MBR is the right call — and a 2026 Fort Worth retrofit cost band
MBR is the right call when one or more of these triggers are present: TCEQ TPDES permit language is tightening on residual microplastics or sub-50 μm TSS, the plant has a water-reuse target for cooling-tower makeup (the MBR permeate is essentially reuse-ready), available plot area for new clarifiers/sludge handling is under 400 m2, or fines are visible in the clarifier overflow on a regular basis. In the Trinity River industrial corridor north and east of downtown Fort Worth, footprint pressure alone often forces the conversation.
The 2026 retrofit CAPEX delta for adding MBR capacity on top of an existing CAS train — converting the aeration basin to a membrane tank, adding a cassette rack, CIP skid, and upgraded blower — is roughly USD 350–900 per m3/day of MBR capacity for a 50–500 m3/day plastics-line retrofit. Treat this as an engineering estimate range, not a vendor quote; actual pricing depends on cassette area, frame material (SS304 vs SS316), CIP skid scope, and whether you reuse the existing aeration basin walls. The decision matrix below summarizes the engineering call.
| Decision Factor | Stay with CAS | Retrofit to MBR |
|---|---|---|
| Existing aeration basin life | ≥8–10 yr | <8 yr, or space for cassette conversion |
| TCEQ TSS / microplastics trend | Stable at 30+ mg/L MA | Tightening toward 10 mg/L or residual MPs |
| Water reuse target | None | Cooling-tower makeup, scrubber supply |
| Available plot area | >400 m2 | <400 m2 or constrained corridor |
| Visible fines in clarifier overflow | Rare | Frequent / reportable |
| Sludge hauling (polymer-rich) | Manageable | High — MBR lower yield helps (plate-frame filter press downstream) |
The 10-year OPEX delta is where most Fort Worth plants get surprised. MBR runs higher on aeration energy and CIP chemicals, but it offsets that with lower waste-activated-sludge volume (Mannina et al., 2020, on low cell yield) and fewer TCEQ excursion events — which means fewer resampling costs, less emergency polymer dosing, and a cleaner compliance record under TCEQ self-monitoring. For a plastics plant whose sludge hauling contract is sized to handle polymer-rich WAS from a low-SRT clarifier train, the hauling reduction alone is sometimes enough to fund the membrane CIP budget.
Frequently Asked Questions
What is the single biggest reason a Fort Worth plastics plant should pick MBR over CAS in 2026?
Sub-50 μm polymer fines and rubber crumb. A CAS clarifier cannot retain them; a 0.1 μm PVDF MBR membrane retains them on a physical cutoff, and the MBR permeate runs ~0.4 MP/L versus ~1.0 MP/L for CAS (Lares et al., 2018, via Mannina et al., 2020). That is the plastics-line-specific differentiator no clarifier upgrade can match.
How much extra energy does an MBR use compared with a conventional activated-sludge system?
Plan for 10–20% higher specific energy demand, driven by membrane scouring aeration and CIP system loads (Mannina et al., 2020). The energy penalty is real and should appear as its own OPEX line in any 2026 retrofit budget; direct GHG is essentially a wash at 0.91 versus 0.85 kgCO2eq/m3.
Can an existing CAS aeration basin be converted to a submerged MBR without building a new tank?
Yes, and it is the common 2026 retrofit pattern. An existing aeration basin is typically repurposed as the membrane tank, the secondary clarifier is decommissioned, and an integrated MBR membrane bioreactor system with DF series PVDF flat sheet modules is installed inside it. Expect an engineering-estimated USD 350–900 per m3/day of added MBR capacity for a 50–500 m3/day plastics-line project, depending on frame material and CIP scope (engineering estimate, 2026).
Does MBR effluent meet TCEQ TPDES industrial discharge limits for plastics and rubber plants?
Yes. A properly operated submerged MBR typically delivers TSS <5 mg/L, COD 20–40 mg/L, and oil & grease <2 mg/L after DAF pretreatment, well within typical TCEQ TPDES industrial limits (per TCEQ TPDES framework, 2026). For cooling-tower makeup reuse, the MBR permeate generally meets the additional conductivity, silica, and biological control targets with minor polishing.