

What 'Design Criteria' Means for a Clinic WWTP in 2026
Clinic wastewater treatment design criteria in 2026 are built on three numeric anchors: effluent BOD5 and TSS each below 30 mg/L, fecal coliform below 200 CFU/100mL, and a 6-log pathogen reduction per EPA 2024. Hydraulic basis is Q_peak = 2.5 × Q_avg with 0.2 m³/day per patient bed. MBR (PVDF 0.1 µm), extended aeration (24-hr HRT), and ozone (0.4–2.0 mg/L, CT 1.6) are the three EPA-compliant trains, each with a defined sizing equation.
For an engineer-of-record preparing a 10-States-style engineering report, "design criteria" is a numeric set, not a narrative. It consists of five interlocking layers: influent characterization, effluent limits, hydraulic basis, redundancy provisions, and unit-process sizing equations. 10-States Standards 2014 Chapter 10 (Engineering Reports) and Chapter 11 (Engineering Report or Facility Plan) require that the report demonstrate, for each unit operation, that the system performs with the largest unit out of service (10-States Paragraph 11). That redundancy line is the single item most competitor pages skip.
Clinic criteria diverge from municipal because the contaminant profile is different. Pharmaceutical residues — antibiotics, hormones, contrast media — sit at 0.1–10 µg/L in raw clinic wastewater (EPA 2023 Emerging Contaminants Report), and fecal coliform routinely hits 10^6–10^8 CFU/100mL, 2–4 logs above typical domestic sewage. Any 2026 design report that uses municipal defaults without correcting for these two loadings will under-size disinfection and miss the pharmaceutical effluent targets now appearing in state permits.
Influent and Effluent Parameter Matrix
Influent and effluent numbers for clinic systems are the foundation of every downstream sizing calculation. State EPA 2023 sampling data and EPA Onsite Wastewater Treatment Systems Manual (2002) figures consolidate into the matrix below. Removal benchmarks fall out directly: 85–95% BOD5, 92–97% TSS, 6-log pathogen, and 70–99% pharmaceutical reduction when advanced treatment is in the train.
| Parameter | Influent (clinic raw) | Effluent (EPA secondary + state) | Removal target |
|---|---|---|---|
| BOD5 | 150–400 mg/L | <30 mg/L | 85–95% |
| TSS | 100–300 mg/L | <30 mg/L | 92–97% |
| COD | 300–800 mg/L | <100 mg/L (typical) | 80–90% |
| pH | 6.5–8.5 | 6.5–8.5 | — |
| NH3-N | 20–40 mg/L | <10 mg/L (state-dependent) | 50–75% |
| Fecal coliform | 10^6–10^8 CFU/100mL | <200 CFU/100mL | 6-log |
| Pharmaceuticals (antibiotics, hormones) | 0.1–10 µg/L | Vermont 0.1 µg/L estradiol; CA PFAS pending | 70–99% (with advanced oxidation) |
The pharmaceutical row is what separates a 2026 design from a 2018 retrofit. Vermont's 0.1 µg/L estradiol limit and California's pending PFAS rules for medical facilities are now the binding effluent targets in those jurisdictions, and they drive the technology choice upstream (per EPA 2024 State Program Status Report). For designers working in states without numeric pharma limits, treat the Vermont benchmark as the default design floor — it is the only state-level number currently in print.
Hydraulic Basis and Flow Equalization
Hydraulic basis sets the size of every downstream unit. For clinic systems, average daily flow is calculated as 0.2 m³/day per patient bed plus 0.05 m³/day per staff member (HydropureWater field data, 2026). A 20-bed clinic with 15 staff therefore generates 0.2 × 20 + 0.05 × 15 = 4.75 m³/day average. Small clinics fall in the 0.5–10 m³/h range; multi-specialty facilities run 10–50 m³/h.
Peak flow follows Q_peak = 2.5 × Q_avg. Worked for the 20-bed example: Q_peak = 2.5 × 4.75 = 11.9 m³/day ≈ 0.5 m³/h sustained peak, with instantaneous spikes during morning clinic start-up. Equalization volume is sized as V_EQ = Q_peak × t_retent, with t_retent ≥ 6–8 hr to absorb the morning ramp and the evening flush (10-States Paragraph 65, flow equalization). For the 20-bed example, V_EQ = 0.5 × 7 = 3.5 m³, plus 25% redundancy margin per 10-States Paragraph 11.
10-States also requires that with the largest equalization pump or aerator out of service, the plant can still treat peak flow. For clinic systems this is typically met by installing duty/standby EQ pumps (n+1) and oversized aeration redundancy. The redundancy check is what gets the engineering report past a state reviewer on the first pass — and is the gap in most competitor write-ups.
Unit-Process Sizing Criteria
Unit-process sizing is where design criteria become equipment specs. The table below consolidates the four equations an engineer needs in a clinic design report — V = Q × t (reactor volume), A = Q / J (membrane area), C × t = 1.6 (disinfection CT), and P_x = Y_obs × (S_0 − S) × Q (sludge production) — alongside the operating parameters that go with each.
| Unit process | Design equation | Operating parameter | Source |
|---|---|---|---|
| Screening (headworks) | — | Bar spacing 6–10 mm | 10-States Chapter 60 |
| Primary settling | A = Q / overflow rate | 24–32 m³/m²/day | 10-States Paragraph 72 |
| Secondary settling | A = Q / overflow rate | 16–24 m³/m²/day | 10-States Paragraph 72 |
| Biological reactor (extended aeration) | V = Q × t | t = 24 hr; SRT 20–30 d; MLSS 1,500–3,000 mg/L | 10-States Chapter 90 |
| MBR tank | V = Q × t | t = 18–24 hr; MLSS 3,000–5,000 mg/L | Norweco/DF-Series spec |
| Aeration | — | 2,100 ft³ air/lb BOD; 0.8–1.2 kWh/m³ (MBR) | Norweco/DF-Series spec |
| Membrane area | A = Q / J | J = 15–25 LMH, PVDF 0.1 µm | DF-Series spec |
| Disinfection (CT basis) | C × t = 1.6 | Cl2 1–5 mg/L × 30 min; UV 40–120 mJ/cm²; O3 0.4–2.0 mg/L × 10–30 min | EPA 2024 |
| Sludge production | P_x = Y_obs × (S_0 − S) × Q | Y_obs = 0.3–0.5 kg TSS/kg BOD removed | EPA 2002 Manual |
The CT equation is the one most often miscalculated. For 4-log virus inactivation, C × t = 1.6 (mg/L × min). At an ozone residual of 0.8 mg/L, contact time must be ≥ 2 min; at a chlorine residual of 2 mg/L, ≥ 0.8 min — but real-world designs derate to 30 min for chlorine to account for demand and decay. For a packaged clinic reactor, the same flow can be served by either a HydropureWater MBR membrane bioreactor system (membrane area sized from A = Q / J) or an extended aeration tank (volume sized from V = Q × t). Sludge produced downstream is dewatered with a HydropureWater plate and frame filter press to reach 22–28% dry solids for off-site disposal.
Technology Selection: MBR vs. Extended Aeration vs. Ozone
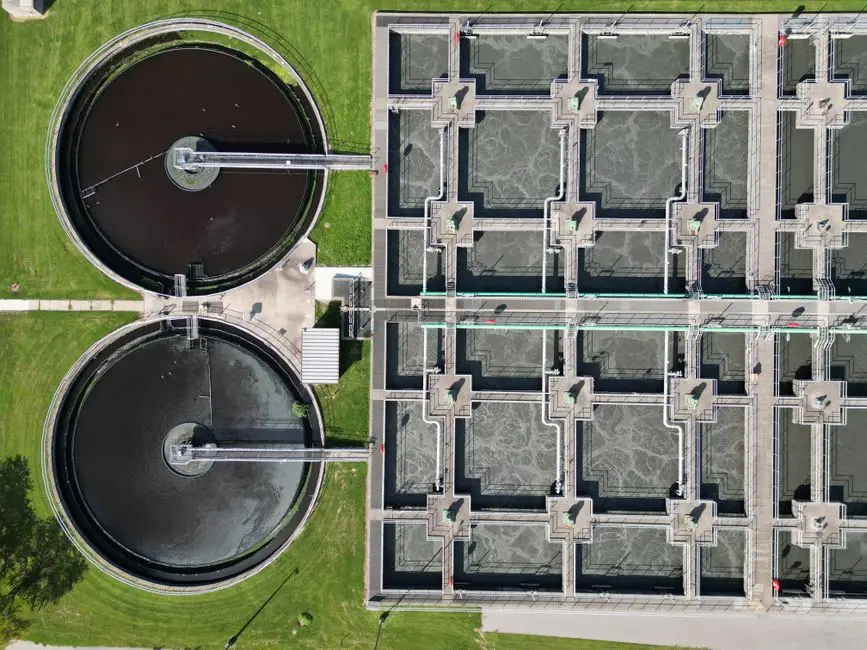
Three technology trains meet EPA secondary plus 6-log disinfection for clinic-scale flows. Selection hinges on footprint, reuse intent, and pharma load — not on BOD removal alone, since all three can hit the <30 mg/L BOD5 effluent target when sized correctly.
| Criterion | MBR (PVDF 0.1 µm) | Extended Aeration | Ozone (standalone polish) |
|---|---|---|---|
| HRT / contact | 18–24 hr | 24 hr | 10–30 min |
| Footprint | 60% smaller than CAS | Largest (land-intensive) | Smallest (vessel only) |
| Pharma removal | 70–90% | 30–50% | 90–99% |
| Pathogen log reduction | 4–5 log (membrane) + disinfection | 1–2 log (biological) + disinfection | 4–6 log |
| Energy | 0.8–1.2 kWh/m³ | 0.5–0.9 kWh/m³ | 0.6–1.0 kWh/m³ (O2 feed) |
| CAPEX | $15k–$50k | $20k–$80k | $10k–$30k (disinfection only) |
| OPEX | $0.50–$1.50/m³ | $0.30–$1.00/m³ | $0.20–$0.80/m³ |
| Best fit | Urban / reuse / space-constrained | Rural / land-rich / no reuse | High-pathogen risk (dialysis) or polish step |
Selection rule: MBR + ozone for urban clinics with reuse goals or pharma-sensitive discharges; extended aeration for rural sites with land and no reuse mandate; ozone-only retrofit where an existing biological step already hits BOD/TSS. For modular packaged delivery at the small-clinic scale, DF Series PVDF flat sheet membrane modules pair with the medical wastewater treatment system, while a chlorine dioxide generator covers the high-pathogen dialysis niche.
Reuse vs. Discharge Decision Framework
The end-of-pipe criteria drive upstream sizing, so the discharge-vs-reuse decision must be locked in before the MBR or extended aeration tank is sized. The framework below is the one a state reviewer expects in the engineering report's "Discharge Alternatives" section.
- Discharge to municipal sewer: meet EPA secondary plus local POTW limits (typically BOD5 <30 mg/L, TSS <30 mg/L, fecal <200 CFU/100mL). Extended aeration alone is often sufficient; no reuse polish required.
- On-site reuse (toilet flushing, irrigation): meet EPA 2018 Water Reuse Guidelines or state reuse criteria — typically BOD5 <10 mg/L, TSS <5 mg/L, fecal coliform <14 CFU/100mL. Requires MBR + UV or ozone polish.
- Surface discharge (stream, lake): state-specific limits apply via Title 22 (CA), 30 TAC §217 (TX), 64E-6 (FL), etc. Design effluent is the most stringent of the three.
Decision matrix: sewer discharge → extended aeration; surface discharge → MBR; reuse → MBR + ozone/UV. A packaged containerized wastewater treatment system fits all three cases when sized against the right end-of-pipe criteria.
2026 State Regulatory Snapshot
State codes override the federal floor where they are more stringent. The 10 most-cited state permits for clinic WWTPs in 2026, with their specific code citations, are listed below. Where state code is silent, 10-States Standards 2014 serves as the default design basis (per 10-States Foreword, p. v).
| State | Code citation | 2026 emerging rule |
|---|---|---|
| California | Title 22 | Pending PFAS limits for medical facilities |
| Texas | 30 TAC §217 | — |
| Florida | 64E-6 | — |
| New York | 10 NYCRR Part 75 | — |
| Massachusetts | 314 CMR 12.00 | — |
| Washington | WAC 246-272A | — |
| Oregon | OAR 340-071 | — |
| Pennsylvania | 25 Pa. Code Ch. 73 | — |
| Illinois | 35 Ill. Adm. Code 605 | — |
| Arizona | R18-9-A302 | — |
| Vermont | — | 0.1 µg/L estradiol limit (binding pharma target) |
For a side-by-side equipment spec that complements the codes above, see HydropureWater's clinic wastewater specifications overview. For the downstream sludge handling math, the sludge dewatering design criteria guide pairs the P_x equation from the sizing table with filter-press selection.
Cost Bands and CAPEX/OPEX for 2026
CAPEX and OPEX bands for 2026 procurement are derived from HydropureWater field data and cross-checked against vendor quotes for clinic-scale packaged systems. MBR systems span $15k–$50k installed; extended aeration $20k–$80k; ozone as a standalone disinfection polish $10k–$30k. Packaged clinic units in the MBR family — including the compact medical wastewater system — land in the lower third of the MBR band because headworks and EQ are integrated.
OPEX is dominated by energy for MBR (0.8–1.2 kWh/m³) and by oxygen feed for ozone (0.6–1.0 kWh/m³). Membrane replacement every 5–8 years is the single largest mid-life cost for MBR systems and should be carried as a sinking-fund line in the lifecycle OPEX. Chemical conditioning for the downstream filter press is dosed with an automatic chemical dosing system, typically polymer at 2–6 kg/ton dry solids, which is a small but non-zero OPEX item.
Frequently Asked Questions
What does "design criteria" mean for a clinic WWTP?
Design criteria is a numeric set covering five layers: influent characterization (BOD5 150–400 mg/L, TSS 100–300 mg/L, fecal 10^6–10^8 CFU/100mL), effluent limits (BOD5 <30, TSS <30, fecal <200), hydraulic basis (Q_peak = 2.5 × Q_avg), redundancy per 10-States Paragraph 11, and unit-process sizing equations. The output is a sizing memorandum, not a narrative (per 10-States Chapter 10/11/53).
What are the three primary sizing equations used for a clinic WWTP?
The three are V = Q × t for reactor volume (e.g., 24-hr HRT biological tank), A = Q / J for membrane area (with J = 15–25 LMH for PVDF 0.1 µm), and C × t = 1.6 for disinfection contact time (the CT basis for 4-log virus inactivation per EPA 2024). Sludge is sized separately via P_x = Y_obs × (S_0 − S) × Q.
How is the EPA 2024 6-log pathogen reduction met?
Six-log reduction is met by combining biological removal (typically 1–2 log) with a disinfection step sized to CT = 1.6 — either ozone at 0.4–2.0 mg/L with 10–30 min contact, chlorine at 1–5 mg/L with 30 min contact, or UV at 40–120 mJ/cm². EPA 2024 sets the 6-log target; the CT = 1.6 value is the engineering translation of that target (per EPA 2024 disinfection guidance).
What is the peak flow rule for sizing clinic systems?
Peak flow is Q_peak = 2.5 × Q_avg, with Q_avg = 0.2 m³/day per patient bed plus 0.05 m³/day per staff (HydropureWater field data, 2026). A 20-bed, 15-staff clinic therefore runs ~4.75 m³/day average and ~11.9 m³/day peak. Equalization volume is sized for t_retent ≥ 6–8 hr per 10-States Paragraph 65.
MBR vs. extended aeration — which fits a clinic-scale project?
MBR fits urban, space-constrained, or reuse-driven projects: 60% smaller footprint, 70–90% pharma removal, CAPEX $15k–$50k. Extended aeration fits rural, land-rich, no-reuse projects: 24-hr HRT, 2,100 ft³ air/lb BOD, CAPEX $20k–$80k, lower pharma removal (30–50%). For regional context on packaged hospital plants, see the Belo Horizonte hospital sewage plant buyer's guide.