
What Sludge Dewatering Design Criteria Control in Practice
Sludge dewatering design criteria set cake dryness, solids recovery, polymer dose, and volume-reduction targets before equipment is chosen. In 2026 practice, mechanical units lift feed solids from 0.5–4% TS to ≥20% cake dryness. Solids capture of 95–99% is typical when polymer conditioning runs at 5–15 lb/dry ton. Disposal route fixes the dryness floor more than equipment brand does.
Four KPIs govern every dewatering decision. Cake dryness is the percent total solids (%TS) in the dewatered cake, measured by drying at 103–105 °C per the EPA manual. Solids recovery is the fraction of feed solids captured in the cake rather than lost to filtrate or centrate, with ≥95% as the working minimum for most industrial plants. Polymer consumption is reported in pounds of active polymer per dry ton of feed solids (lb/dry ton) and drives operating cost more than any other variable. Volume reduction ratio is the ratio of feed sludge volume to cake volume and translates directly into hauling and disposal economics.
Sludge water is not a single phase. The DuBois bulletin splits total sludge water into four populations. Free water can reach 75% of total water and leaves under gravity, centrifugal, vacuum, or pressure force. Floc water can reach 20% and leaves under vacuum, centrifugal, or pressure. Capillary water adheres by physical attraction and needs pressure. Bound water is chemically bonded and will not leave in a mechanical dewatering unit. Mechanical units recover free water and part of the floc water. Cake above 20% TS means the device is stripping capillary water, where equipment envelopes diverge sharply. What the cake must do next — landfill, incineration, or land application — sets the right criteria more than the equipment name does.
Feed Sludge Characterization: The First Design Gate
Every mechanical dewatering unit is sized against the feed it sees, not the feed the designer wishes it had. The EPA manual's secondary activated sludge yield of 0.75–0.90 kg EAS/kg BOD5 applies at typical domestic loadings of 400 mg/L COD and 200 mg/L BOD5/TSS. That yield is the starting point for any biological stream. Industrial primaries typically run 2–5% TS. That is lower than the 30% TS municipal primary figure the EPA worked example assumes.
The classic EPA 60:40 mixed-cake calculation shows how to combine streams. With 30% TS primary and 17% TS WAS at a 60:40 ratio, %TSmixture = (60 × 30 + 40 × 17) / 100 = 23% TS. The same formula is the engineer's tool for industrial streams. Substitute the actual ratio and the actual per-stream %TS, and you have the feed the dewatering device will see. Where industrial primaries sit at 2–5% TS, the mixed feed often falls to 8–14% TS. Thickening upstream is rarely optional in that case.
How you select a clarifier system for industrial wastewater is upstream of sludge dewatering design criteria; selecting clarifier underflow %TS first keeps press feed stable. Two upstream variables control which dewatering technology will perform. Sludge Volume Index (SVI) is the key handle for decanter centrifuge design. EPA Figure 7-15 shows that high-SVI activated sludge degrades centrifugal dewatering sharply, because poorly settling floc shatters in the bowl. Particle size distribution is the lever for vacuum and pressure filtration. EPA Figure 3-5 shows that finer particles raise specific resistance to filtration and cut throughput. The most common de-risking step is thickening to 3–5% TS via gravity thickener, DAF, or lamella. Each extra point of feed solids roughly halves volumetric load on the unit downstream. For plants struggling with poor upstream settling, the field guide on solving poor sludge settling walks through the upstream controls that set downstream dewatering performance. Digested biological streams that only reach about digested sludge dewatering 18% cake on a belt often need thicker feed or pressure filtration before disposal contracts pencil out.
Conditioning Criteria: Polymer Dose, Mixing Energy, and Aging Time
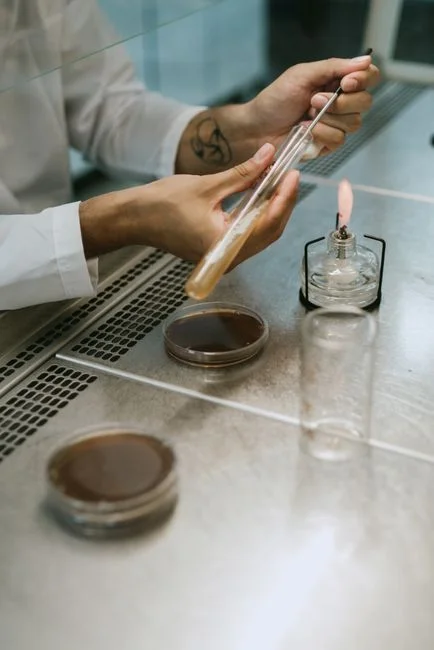
Polymer conditioning is the most cost-sensitive variable in mechanical dewatering. The design numbers are concrete enough to put on a P&ID. The DuBois worked example remains the field standard. At 100 GPM of 3% feed sludge × 8.34 lb/gal × 0.03 ÷ 2000 lb/ton, dry solids equal 0.75 dry tons/hr. At 2 GPM of 0.5% polymer × 8.34 lb/gal × 0.005, polymer feed equals 5 lb polymer/hr. Dividing 5 by 0.75 gives 6.67 lb polymer per dry ton. That number — and the three-step method behind it — is what the design engineer defends in front of procurement.
Industrial dose ranges sit tighter than municipal literature often suggests. Cationic polyacrylamide (CPAM) at 5–15 lb/dry ton is the working range for biological and mixed industrial sludges. Mineral and chemical sludges — metal-finishing hydroxide, DAF float, lime softening residue — typically condition at 2–8 lb/dry ton. Those solids are denser and carry less bound water. Jar tests on actual sludge are non-negotiable. Charge density, molecular weight, and active percent all shift the optimum. A 30% overdose burns straight through the OPEX budget.
Mixing criteria follow a two-stage energy profile. A high-G flash mix at G ≈ 300–500 s⁻¹ for 10–30 seconds disperses polymer and contacts the colloid. A low-G maturation zone at G ≈ 50–80 s⁻¹ for 60–120 seconds lets floc grow without shear damage. Past that window, extra shear breaks floc and tanks solids capture. An in-line static mixer plus a 30–60 s maturation pipe beats a single high-energy mix point. Most plants we size for food and metal-finishing sludge run maturation closer to 60 s than 120 s when pipe volume is tight. The DuBois troubleshooting matrix ties symptoms back to chemistry. "Puddling" on a belt press and cloth blinding both read as overdose. Poor cake dryness with cloudy filtrate reads as underdose. The fix is the same — jar-test, then re-dose.
Equipment-Specific Mechanical Design Criteria
The three workhorse mechanical dewatering technologies are not interchangeable. Each has a design envelope the engineer must match to feed and disposal targets. Belt filter presses operate at 2–5% feed TS with hydraulic loading of 5–15 m³/h per meter of belt width. Polymer dose is 4–10 lb/dry ton, and cake on mixed biological sludge is typically 20–28% TS. Strengths are low energy draw (typically 0.5–1.5 kWh/dry ton) and low capex. Weaknesses are washwater demand (often 10–20% of feed volume) and the largest footprint per unit capacity. Detailed comparisons of belt press sludge dewatering against plate presses help when the dryness target sits near 25% TS and the site already has washwater capacity.
Belt presses are also sensitive to feed variability. A grease slug or a pH drop shows up immediately as poor cake release. Decanter centrifuges handle 2–4% feed TS (up to 8% with pre-thickening) at bowl speeds of 2,500–3,500 RPM. Polymer dose is 8–18 lb/dry ton, and achievable cake is 22–32% TS. Units are sized by sigma factor (Σ) per EPA Figure 7-11, which scales throughput against equivalent settling area of the bowl. Advantages are enclosure, small footprint, and tolerance of oily or greasy streams common in food, metal finishing, and refining. Disadvantages are noise, scroll wear, and high-G shear that shatters weak floc — which is why the SVI caveat above is non-negotiable.
Plate-and-frame filter presses are batch units with 1.5–4% feed TS (higher with pre-thickening). Filtration pressures reach 250 PSI (per DuBois), filtration area spans 1–500 m², and cycle time runs 1–4 hours. Polymer dose is 4–10 lb/dry ton, and achievable cake is 30–60% TS — the highest dryness of the three. The advantage is unmatched cake dryness and the lowest lifecycle cost per dry ton for plants below roughly 50 m³/d sludge. A single batch unit can ride out feed variability at that scale. The disadvantage is batch operation and plate handling, which pushes larger plants toward automated or PLC-controlled designs. As a citable design reference, the Plate and Frame Filter Press for Sludge Dewatering range spans 1–500 m² with manual, hydraulic, and PLC-controlled configurations. That range aligns with the 30–60% cake target in the disposal section below.
| Design Criterion | Belt Filter Press | Decanter Centrifuge | Plate-and-Frame Filter Press |
|---|---|---|---|
| Feed TS range | 2–5% | 2–4% (up to 8% thickened) | 1.5–4% (higher with pre-thickening) |
| Hydraulic / capacity loading | 5–15 m³/h per m belt width | Sigma factor (EPA Fig. 7-11); bowl 2,500–3,500 RPM | 1–500 m² area; 1–4 h cycle |
| Filtration / pressure | Belt tension + roller nip | 2,500–4,000 G centrifugal | Up to 250 PSI hydraulic |
| Polymer dose (CPAM) | 4–10 lb/dry ton | 8–18 lb/dry ton | 4–10 lb/dry ton |
| Achievable cake dryness | 20–28% TS | 22–32% TS | 30–60% TS |
| Solids recovery | 95–98% | 95–99% | 98–99.5% |
| Energy use | 0.5–1.5 kWh/dry ton | 1.5–3 kWh/dry ton | 0.8–2 kWh/dry ton (batch) |
| Footprint / enclosure | Large footprint, open | Compact, fully enclosed | Moderate, enclosed |
| Best-fit application | Municipal/biological, low capex | Oily/greasy, space-constrained, >50 m³/d | Highest dryness, <50 m³/d, landfill-bound cake |
The numbers above are working envelopes, not guaranteed outputs. Belt press cake above 28% TS is achievable on well-digested biological sludge with high-molecular-weight CPAM. Centrifuge cake above 30% TS typically needs polymer at the high end of the range plus pre-thickening. Plate-and-frame at 30–60% TS is the broadest band because feed characteristics, filtration pressure, and cycle time all move the result.
Best centrifuge for municipal wastewater treatment sludge dewatering?
The best centrifuge for municipal wastewater treatment sludge dewatering is a decanter sized by sigma factor for 2–4% feed TS (up to 8% thickened). Bowl speed is 2,500–3,500 RPM, and polymer sits at 8–18 lb/dry ton when the plant needs 22–32% TS cake in an enclosed package. Low-SVI municipal biological sludge fits this envelope. High-SVI activated sludge often fails in the bowl because weak floc shatters under high G. Oily industrial streams from food, metal finishing, and refining usually favor a centrifuge over an open belt when odor control and footprint dominate.
Which sludge dewatering equipment should you choose?
Sludge dewatering equipment selection starts from disposal dryness, feed TS, and daily sludge volume, then maps to the table above. Belt presses fit municipal or biological loads above about 50 m³/d when 20–28% TS is enough and washwater is available. Decanter centrifuges win on enclosure and oily feeds. Plate-and-frame units win when 30–60% TS cake is required and sludge volume stays below roughly 50 m³/d. Capex alone is a weak selector; polymer, haul distance, and redundancy dominate ownership cost.
Matching Cake Dryness to Downstream Disposal Criteria
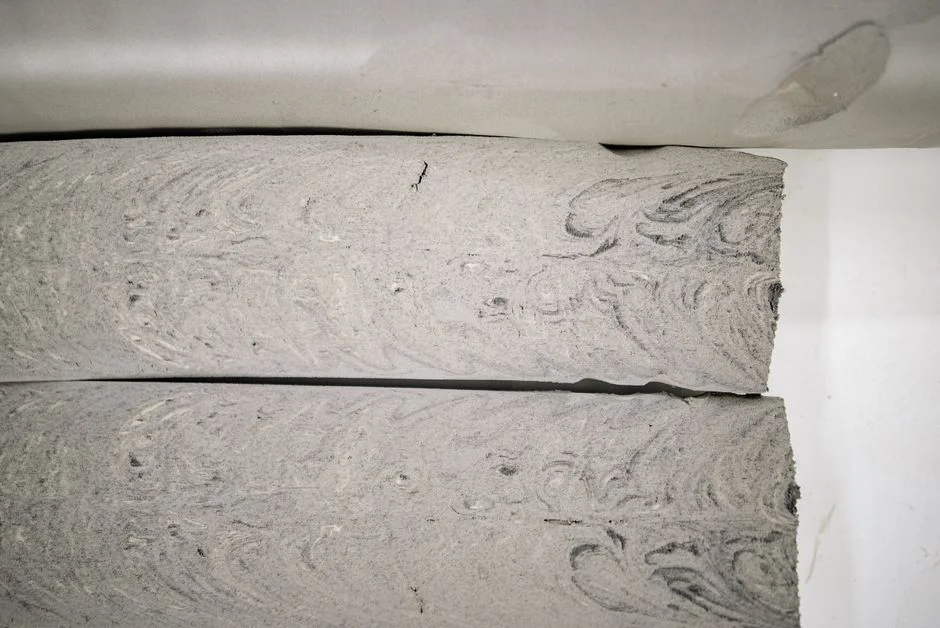
Design criteria do not end at the press discharge. Target cake dryness is set by what the cake must do next. Each disposal route imposes a different threshold. The EPA manual's Table 4-4 maps dewatering processes to ultimate disposal options. Treat that mapping as a starting point, then sharpen it against actual disposal cost. A full sludge dewatering cost comparison should include polymer, energy, washwater, haul, and tipping — not only equipment purchase price.
| Disposal Route | Minimum Cake %TS | Driving Criterion | Cost Lever |
|---|---|---|---|
| Landfill / monofill | ≥20% TS (≥30% if haul >100 km) | Free-liquid rule, leachate minimization | Each +5% TS cuts hauled tonnage proportionally |
| Incineration (autothermal) | ≥25–35% TS | Net-zero auxiliary fuel threshold (EPA Ch. 4) | Below threshold, pay for supplementary fuel |
| Land application (Part 503) | ≥38% TS for VAR Option 1 | Vector-attraction reduction | Avoids additional stabilization OPEX |
| Industrial / hazardous (TCLP-bound) | Set by solids capture & wash quality | Leachability of contaminants from cake | Cake wash + high recovery > dryness alone |
For landfill-bound sludge, the math is linear. A 25% TS cake hauled 50 km costs roughly 25% less per dry ton than a 20% TS cake over the same distance, before any tipping-fee benefit. For incineration, EPA Chapter 4's autothermal threshold sets the floor. Below 25–35% TS, supplementary fuel turns the incinerator into a net energy consumer. For Part 503 land application, vector-attraction reduction Option 1 is satisfied at ≥38% TS for sewage sludge. That is one reason plate-and-frame filter presses are common at plants pursuing land application. Industrial hazardous sludges flip the priority. Once cake goes to a RCRA Subtitle C facility, solids capture and wash quality against TCLP bind harder than dryness alone. A 45% TS cake that leaches metals fails just as badly as a 25% TS cake that leaches the same metals.
How to Validate Design Criteria Before You Buy
Vendor quotes are projections. The design engineer owes procurement a defensible qualification protocol that locks cake dryness, polymer dose, and solids recovery before the purchase order is signed. Four steps cover the gap between bench and bid.
- Jar test for polymer selection and dose. Run a CPAM matrix (charge density × molecular weight × dose) on actual sludge; record supernatant turbidity, capillary suction time (CST), and drained cake weight. The optimum is the dose that gives the clearest supernatant and the fastest drain, not the dose that gives the largest floc.
- Buchner funnel specific resistance (SRF) or CST test. This converts floc behavior into a single number that ranks dewatering technologies quantitatively. High SRF (>1×10¹³ m/kg) generally favors pressure filtration; low SRF can be served by belt press or centrifuge.
- Pilot trial of the shortlisted equipment, 4–8 weeks. Capture cake %TS, polymer dose in lb/dry ton, filtrate or centrate TSS, washwater ratio, and specific energy in kWh/dry ton. The pilot is also the right place to test sensitivity to feed variability — run a worst-case day on purpose.
- 72-hour continuous run at design loading. Require ≤10% deviation from pilot-validated cake dryness and solids recovery before acceptance. Anything beyond that band is a performance shortfall that should trigger a process guarantee conversation, not a commissioning handshake.
For plants with variable feed streams — food processors on seasonal campaigns, metal finishers with batch dumps, pulp mills with intermittent cleanouts — repeat the validation at two or more feed conditions. A design that only works on the average day fails on the worst day. The worst day is when disposal cost spikes.
Selection checklist before you freeze the PO:
- Measured feed %TS, SVI or SRF, and peak hourly sludge volume
- Disposal route and minimum cake %TS (20 / 25–35 / 38% as applicable)
- Jar-tested polymer dose in lb/dry ton on actual sludge
- Pilot cake dryness, solids recovery, and kWh/dry ton at design loading
- Washwater balance and filtrate/centrate return impact on the headworks
- +20% peak-flow margin and N+1 redundancy plan above 100 m³/d
- Acceptance band: ≤10% deviation from pilot cake dryness and recovery
Who This Is For / Next Step
This guide is for plant engineers, EPC designers, and procurement managers sizing mechanical dewatering against a known disposal contract. When feed data and disposal limits are ready, send an equipment sizing inquiry. We will check cake target, polymer dose, and equipment envelope against your sludge sample before the bid package locks.
Frequently Asked Questions
What cake dryness should I target for landfill disposal?
Target ≥20% TS as the floor to satisfy the paint-filter free-liquid test and to cut leachate generation. Target ≥30% TS if haul distance exceeds 100 km, because each extra 5% TS cuts hauled tonnage proportionally and often dominates tipping-fee savings. Plants hauling under 50 km often stay near 20–25% TS when tipping fees are moderate and polymer OPEX is the tighter constraint.
How do I calculate polymer dose?
Use the DuBois three-step method: dry tons/hr from GPM, TS fraction, and 8.34; polymer lb/hr from polymer GPM and strength; dose equals polymer lb/hr divided by dry tons/hr. The worked example at 100 GPM of 3% TS and 2 GPM of 0.5% polymer yields 0.75 dry tons/hr, 5 lb polymer/hr, and 6.67 lb/dry ton. Biological sludge usually lands at 5–15 lb/dry ton; mineral sludge at 2–8. Confirm with jar tests.
Belt press vs. centrifuge vs. plate-and-frame filter press — which to pick?
Use the design-criteria table above. Belt presses win on capex and energy for municipal-biological sludge above 50 m³/d when 20–28% TS is enough. Decanter centrifuges win on footprint, enclosure, and oily streams, delivering 22–32% TS at higher polymer dose and noise. Plate-and-frame presses win on 30–60% TS cake, 98–99.5% recovery, and lowest lifecycle cost per dry ton below about 50 m³/d when cake is landfill- or incineration-bound.
Can I skip sludge thickening?
Only if feed TS is already ≥4%. Below that, the dewatering device carries a volumetric load it was not designed for. Hydraulic capacity is exceeded, polymer dose rises disproportionately, and cake dryness drops. The capital penalty of oversizing the dewatering unit to absorb dilute feed almost always exceeds the cost of a small gravity thickener, DAF, or lamella upstream.
What design margin should I apply?
Apply +20% to peak hourly flow, +10% to the cake-dryness target, and add one contingency dewatering unit above N+1 redundancy at plants larger than 100 m³/d. These three margins cover feed variability, polymer supplier drift, and the inevitable maintenance day without padding the OPEX budget.