Clinic wastewater treatment specifications under EPA standards hold effluent below 30 mg/L BOD5 and TSS, with fecal coliform below 200 CFU/100mL after disinfection. Typical clinic influent runs BOD5 150–400 mg/L, TSS 100–300 mg/L, and flow 0.5–10 m³/h.
Clinic Wastewater Treatment Specifications: EPA Standards in Practice
Clinic wastewater systems must meet pathogen, BOD, and TSS limits under EPA secondary treatment and state health rules. Design starts from influent BOD5 150–400 mg/L and TSS 100–300 mg/L, then targets effluent below 30 mg/L for both and fecal coliform below 200 CFU/100mL. Disinfection for 4-log virus inactivation commonly uses chlorine 1–5 mg/L, UV 40–120 mJ/cm², or ozone 0.4–2.0 mg/L.
Small clinics commonly flow 0.5–10 m³/h. Larger multi-specialty campuses can reach 10–50 m³/h on procedure days. Those hydraulic bands, not brochure capacity labels, should set blower, membrane, and contact-tank sizes before a purchase order is issued.
Why Clinic Wastewater Differs from Residential or Industrial Systems
Clinic wastewater differs from residential sewage and most industrial streams because pharmaceuticals, pathogens, and disinfectant byproducts arrive in one intermittent discharge. Pharmaceutical residues such as antibiotics and hormones commonly appear at 0.1–10 µg/L. The EPA 2023 Emerging Contaminants Report links those concentrations to aquatic ecosystem stress and antimicrobial-resistance pathways when treatment is incomplete.
Pathogen loads in medical facility wastewater are much higher than domestic averages. Fecal coliform counts often reach 10^6–10^8 CFU/100mL, and viral contaminants such as norovirus and SARS-CoV-2 may be present. EPA 2024 pathogen-control guidance used on clinic projects calls for a 6-log reduction pathway when public exposure risk is high. Cleaning chemicals also form chloramines and trihalomethanes regulated under the EPA Stage 2 DBP Rule; EPA describes that rule as strengthening public health protection by tightening compliance monitoring requirements for trihalomethanes (TTHM) and haloacetic acids (HAA5).
Enforcement risk is concrete. A 2024 California Water Boards Enforcement Report case recorded a $45,000 fine against a clinic for non-compliant pharmaceutical discharge. That is why outpatient facilities need clinic-specific process trains rather than generic domestic package plants. Engineers often compare a broader Medical Wastewater Treatment System Specifications: 2026 Engineering Data package before freezing the equipment list and permit narrative. Search logs still bring some readers in on the phrase medical equipment water treatment environmental engineering; this page covers that same scope — equipment selection, effluent standards, and the environmental permitting behind an outpatient clinic plant.
What is the medical facility wastewater pharmaceutical removal process?
The medical facility wastewater pharmaceutical removal process chain runs biological treatment, adsorption, then oxidation. MBR trains typically remove 70–90% of many compounds, activated carbon filtration removes about 50–80%, and ozone oxidation can reach 90–99%, according to a 2024 WEF study cited in prior design notes. Because residues enter at 0.1–10 µg/L, polishing capacity rather than secondary clarification sets the final effluent number.
2026 Regulatory Standards for Clinic Wastewater: EPA, State, and Local Requirements
Federal design still references the EPA Onsite Wastewater Treatment Systems Manual (2002) for siting, hydraulics, and basic environmental protection, and EPA's decentralized-systems program still frames the onsite permitting conversation for facilities outside the sewer network. State rules add the enforceable numbers. California Title 22, Texas 30 TAC §217, and Florida Chapter 64E-6 each define effluent quality, system design, and permitting steps that medical facilities must clear before discharge starts.
Disinfection criteria stay tight because influent pathogen counts are high. For 4-log virus inactivation, EPA 2024 guidance commonly lists chlorine residual 1–5 mg/L, UV dose 40–120 mJ/cm², or ozone 0.4–2.0 mg/L as working targets. Emerging state limits also address pharmaceuticals. Vermont cites an estradiol example limit of 0.1 µg/L, while California continues pending PFAS limits for medical facilities. Local health departments may allow variances for small clinics, such as adjusted retention time or alternate disinfection, only when equivalent public-health protection is documented in the permit file.
Most plants we size for outpatient clinics run disinfection at the lower end of those dose bands during average flow, then prove CT or UV dose at the documented peak. That approach avoids overdosing byproducts while still meeting fecal coliform below 200 CFU/100mL on the highest pathogen day.
What are the outpatient clinic wastewater disinfection requirements?
Outpatient clinic wastewater disinfection requirements target fecal coliform below 200 CFU/100mL after a disinfection step sized for the site permit. Working doses for 4-log virus inactivation are chlorine residual 1–5 mg/L, UV 40–120 mJ/cm², or ozone 0.4–2.0 mg/L. Variances are possible only where equivalent public-health protection is documented in the permit file.
The following table summarizes key regulatory benchmarks for clinic wastewater treatment:
| Parameter | EPA Secondary Treatment Standard | Disinfection Standard (EPA 2024) | Emerging Pharmaceutical Limits (Example) |
|---|---|---|---|
| BOD5 | <30 mg/L | N/A | N/A |
| TSS | <30 mg/L | N/A | N/A |
| Fecal Coliform | N/A | <200 CFU/100mL | N/A |
| Chlorine Residual | N/A | 1–5 mg/L | N/A |
| UV Dose | N/A | 40–120 mJ/cm² (for 4-log virus inactivation) | N/A |
| Ozone Concentration | N/A | 0.4–2.0 mg/L (for 4-log virus inactivation) | N/A |
| Estradiol | N/A | N/A | 0.1 µg/L (Vermont) |
| PFAS | N/A | N/A | Pending (California) |
Key Process Parameters: Influent, Effluent, and Removal Benchmarks
Clinic influent quality based on EPA 2023 data used in sizing packages typically shows BOD5 150–400 mg/L, TSS 100–300 mg/L, and COD 300–800 mg/L. pH usually sits between 6.5 and 8.5. Fecal coliform can reach 10^6–10^8 CFU/100mL, so disinfection capacity must track peak pathogen load rather than average day only.
EPA secondary treatment targets keep effluent BOD5 below 30 mg/L and TSS below 30 mg/L. Fecal coliform is held below 200 CFU/100mL after disinfection. Ammonia is commonly held below 10 mg/L where nitrogen limits apply. Removal benchmarks used on clinic projects are 85–95% BOD reduction, 92–97% TSS removal, and a 6-log pathogen reduction pathway when the infection-control plan requires it.
Pharmaceutical removal needs advanced unit processes beyond secondary clarification. MBR trains typically remove 70–90% of many compounds. Activated carbon filtration removes about 50–80%. Ozone oxidation can reach 90–99%, according to a 2024 WEF study cited in prior design notes. Flow still drives cost: small clinics often generate 0.5–10 m³/h, while multi-specialty sites may produce 10–50 m³/h.
A practical hydraulic rule is about 0.2 m³/day per patient bed or 0.05 m³/day per staff member, then adjust for dialysis or procedure-day peaks. HydropureWater packages such as the compact MBR system for clinic wastewater treatment fit tight plant rooms. The Medical & Hospital Wastewater Treatment System adds automated disinfection when pathogen limits drive the permit.
What are the clinic wastewater BOD TSS effluent limits?
Clinic wastewater BOD and TSS effluent limits follow EPA secondary practice: below 30 mg/L for both BOD5 and TSS. In 40 CFR 133.102 that floor reads as a 30-day average that shall not exceed 30 mg/l, a 7-day average not above 45 mg/l, and a 30-day average percent removal not less than 85 percent. Removal benchmarks on clinic projects run 85–95% BOD and 92–97% TSS.
The following table outlines key process parameters and benchmarks:
| Parameter | Typical Influent Quality (Clinics) | Required Effluent Quality (EPA Secondary) | Removal Efficiency Benchmark |
|---|---|---|---|
| BOD5 | 150–400 mg/L | <30 mg/L | 85–95% |
| TSS | 100–300 mg/L | <30 mg/L | 92–97% |
| COD | 300–800 mg/L | N/A | N/A |
| pH | 6.5–8.5 | 6.0–9.0 | N/A |
| Fecal Coliform | 10^6–10^8 CFU/100mL | <200 CFU/100mL | 6-log reduction |
| Ammonia | N/A | <10 mg/L | N/A |
| Pharmaceuticals | 0.1–10 µg/L | Emerging limits | 70–99% (with advanced treatment) |
Equipment Selection: MBR, Extended Aeration, and Ozone Disinfection
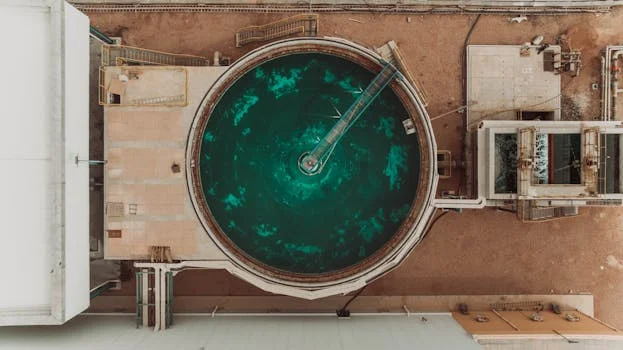
Equipment selection for a medical facility starts with influent strength, permit limits, available floor area, and O&M skill on site. The three trains most often shortlisted for clinics are membrane bioreactors (MBR), extended aeration, and ozone disinfection as a polishing or dedicated pathogen barrier.
MBR systems combine biological treatment with membrane filtration, typically PVDF membranes at about 0.1 µm pore size. Footprint is often up to 60% smaller than conventional activated sludge, which suits urban clinics. Energy use commonly falls in the 0.8–1.2 kWh/m³ range. Pharmaceutical removal sits around 70–90% per DF Series field data. HydropureWater integrated MBR systems are frequently selected when reuse-quality effluent is required in a tight plant room.
Extended aeration systems use long aeration retention, typically about 24 hours in the basin. Air demand is roughly 2,100 ft³ of air per pound of BOD applied daily, per Norweco specifications. Land need is higher, so rural campuses fit better. Sludge yield is lower at about 0.3–0.5 kg TSS/kg BOD removed, which simplifies solids handling for small staff teams.
Ozone disinfection systems target pathogen inactivation and pharmaceutical oxidation. Ozone dose is commonly 0.4–2.0 mg/L with 10–30 minutes contact. That CT window delivers about 4–6 log pathogen reduction when monitored correctly. HydropureWater hardware includes an on-site chlorine dioxide generator for clinic wastewater disinfection and automated medical wastewater treatment units with ozone disinfection for high-pathogen settings such as dialysis centers.
Approximate CAPEX bands used in early budgets are $15,000–$50,000 for MBR packages, $20,000–$80,000 for extended aeration, and $10,000–$30,000 for ozone disinfection skids excluding biological treatment. OPEX bands are about $0.50–$1.50/m³ for MBR, $0.30–$1.00/m³ for extended aeration, and $0.20–$0.80/m³ for ozone. Match use-case to site constraints: MBR for compact urban clinics, extended aeration where land is available, ozone where pathogen or pharmaceutical risk dominates the permit. For a parallel equipment and compliance walkthrough, see this medical wastewater treatment system engineering guide.
How do you approach MBR system for clinic wastewater treatment design?
An MBR system for clinic wastewater treatment design starts with PVDF membranes at about 0.1 µm pore size and a flux of 15–25 LMH, sizing membrane area as A = Q / J with standby capacity for cleaning downtime. Energy commonly lands at 0.8–1.2 kWh/m³, and footprint runs up to 60% smaller than conventional activated sludge. Urban clinics with tight plant rooms are the usual fit.
What ozone disinfection dose for clinic pathogen reduction is typical?
The ozone disinfection dose for clinic pathogen reduction is commonly 0.4–2.0 mg/L with 10–30 minutes of contact. That CT window delivers about 4–6 log pathogen reduction when monitoring is correct, and clinic design notes often target C × t = 1.6 for 4-log virus inactivation. Ozone also oxidizes pharmaceutical residuals, which is why dialysis centers treat it as a core barrier rather than an option.
| System Type | Key Features & Parameters | Pros | Cons | Typical Use-Case | CAPEX (Approx.) | OPEX (Approx. /m³) |
|---|---|---|---|---|---|---|
| MBR Systems | PVDF membrane (0.1 µm), 60% smaller footprint, 0.8–1.2 kWh/m³ energy, 70–90% pharma removal | High effluent quality, compact size, high pathogen/pharma removal, suitable for reuse | Higher initial cost, membrane fouling potential, skilled O&M required | Space-constrained urban clinics, high effluent quality demands | $15,000–$50,000 | $0.50–$1.50 |
| Extended Aeration | 2,100 ft³/lb BOD air, 24 hr retention time, 0.3–0.5 kg TSS/kg BOD sludge | Robust, simpler operation, lower sludge production, good for fluctuating flows | Larger footprint, lower effluent quality than MBR, less effective for pharmaceuticals | Rural facilities with land availability, less stringent effluent requirements | $20,000–$80,000 | $0.30–$1.00 |
| Ozone Disinfection | 0.4–2.0 mg/L dosage, 10–30 min contact, 4–6 log pathogen reduction | Highly effective pathogen inactivation, oxidizes pharmaceuticals, no hazardous chemical storage (on-site generation) | High energy consumption, requires pre-treatment for optimal performance, higher CAPEX for full system integration | High-pathogen-risk applications (e.g., dialysis centers), advanced pharmaceutical degradation | $10,000–$30,000 (disinfection only) | $0.20–$0.80 |
Design and Sizing Calculations for Clinic Systems
Clinic hydraulic design must cover intermittent use and procedure-day peaks. A common peak factor is Q_peak = 2.5 × Q_avg, especially for dialysis schedules that dump large volumes in short windows. Undersizing peak capacity is the failure mode we see most often on retrofit audits of outpatient plants.
For extended aeration, basin volume is V = Q × t with t typically 24 hours. Air supply remains about 2,100 ft³ per pound of BOD removed, per Norweco specifications. For MBR membrane area, use A = Q / J. Flux J usually runs 15–25 LMH for PVDF membranes per DF Series data. Add standby area for cleaning downtime so net flux still meets peak day flow.
Ozone CT for 4-log virus inactivation is often targeted near C × t = 1.6, with C in mg/L and t in minutes, following EPA 2024 design notes used in clinic packages. Sludge mass can be estimated as P_x = Y_obs × (S_0 – S) × Q. Y_obs is typically 0.3–0.5 kg TSS/kg BOD removed per the EPA 2002 manual. Dewatering and conditioning usually need hardware such as plate and frame filter presses and automatic chemical dosing systems when solids haul cost dominates OPEX.
Use this selection checklist before issuing a purchase order. Confirm peak-hour flow. Verify BOD, TSS, and pathogen peaks. Pick the biological process by footprint. Pick disinfection by CT or UV dose. Estimate sludge mass. Lock monitoring points for permit reporting. Skipping any one item is how clinics buy a plant that passes average day but fails inspection day.
Compliance Checklist: 10 Steps for Clinic Wastewater Standards
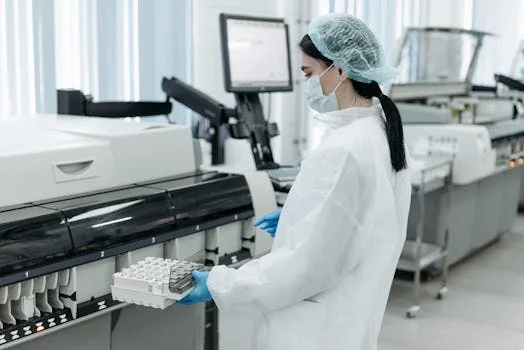
Clinic managers and plant engineers can use the following 10-step checklist to audit permits, performance, and records against current wastewater rules for medical facilities:
- Step 1: Verify local health-department rules and obtain permits. Confirm requirements such as California Title 22 or Texas 30 TAC §217, and secure discharge permits before startup.
- Step 2: Test influent wastewater. Run quarterly BOD, TSS, pH, and fecal coliform sampling to lock the design basis and catch load drift.
- Step 3: Confirm treatment performance. Verify 85–95% BOD removal and 92–97% TSS removal against EPA secondary treatment targets.
- Step 4: Implement robust disinfection. Keep effluent fecal coliform below 200 CFU/100mL with chlorine, UV, or ozone per EPA 2024 pathogen-control practice.
- Step 5: Install monitoring equipment. Use flow meters, pH probes, and turbidity sensors so operators see compliance drift the same day it starts.
- Step 6: Develop a written O&M manual. Document daily, weekly, and monthly tasks, sample logs, and troubleshooting paths for every shift.
- Step 7: Train staff. Cover normal operation, routine maintenance, emergency shutdown, and spill response with signed attendance records.
- Step 8: Conduct annual third-party audits. Include pharmaceutical residues and emerging contaminants such as PFAS as state limits tighten.
- Step 9: Document all activities. Retain testing, maintenance, calibration, and incident records ready for inspections.
- Step 10: Plan upgrades early. Revisit MBR for footprint limits or ozone for high-pathogen and pharmaceutical loads. For stage-by-stage equipment matching, use this engineering guide.
Main cost drivers on clinic projects are membrane or aeration footprint, disinfection energy or chemical use, sludge haul, monitoring instrumentation, and staff time for sampling. CAPEX quotes that omit sludge handling or peak-flow redundancy usually look cheap until the first year of operation.
Cost Drivers and Operating Realities for Clinic Plants
Clinic wastewater OPEX is usually driven by five line items: aeration or membrane scour energy, disinfection chemicals or ozone power, sludge haul, spare parts, and labor for sampling. On MBR trains, energy commonly lands near 0.8–1.2 kWh/m³. Extended aeration often looks cheaper at $0.30–$1.00/m³, but land and tank volume still show up in the CAPEX column.
Most plants we size for outpatient clinics run at the lower end of the disinfection dose band during average flow. Operators then prove CT or UV dose on the documented peak day. That keeps byproduct formation down while still holding fecal coliform below 200 CFU/100mL when pathogen load spikes after procedure blocks.
Sludge is the cost item buyers forget. With Y_obs around 0.3–0.5 kg TSS/kg BOD removed, a clinic treating 400 mg/L BOD5 down to below 30 mg/L still generates a steady solids stream. If haul distance is long, a plate-and-frame press pays back faster than a larger liquid-haul contract. Automatic dosing helps keep polymer use stable when influent strength swings between clinic days and closed days.
Monitoring cost is small compared with a single fine. Flow, pH, and turbidity sensors catch drift early. Quarterly influent testing for BOD, TSS, pH, and fecal coliform keeps the design basis honest. Annual third-party checks for pharmaceuticals and PFAS matter more each year as state limits move from guidance into permits.
Space-constrained urban clinics should shortlist MBR first when reuse or very low TSS is required. Rural sites with land can still use extended aeration if pharmaceutical polishing is handled downstream. Dialysis and high-pathogen rooms should treat ozone or chlorine dioxide as a core barrier, not an optional add-on. Match the train to the permit, not to a generic hospital brochure.
Keep original design numbers in the O&M binder next to the permit. When a state revises disinfection residual or pharmaceutical limits, compare the new limit to the existing CT, UV dose, and polishing train before changing hardware. Earlier project files that used only secondary BOD/TSS targets still need an explicit pathogen barrier review under EPA 2024 practice notes used for clinic packages.
Who This Is For / Next Step
This guide is for clinic facility managers, EPC engineers, and procurement teams sizing or upgrading onsite medical wastewater trains under EPA secondary and state disinfection rules. Look elsewhere if you are expanding a municipal WWTP or treating non-medical industrial COD without pathogen controls. When you need a clinic-specific equipment list matched to flow, pathogen load, and permit limits, submit a clinic wastewater treatment inquiry with influent data and discharge targets.
Frequently Asked Questions
What are the main state standards for clinic wastewater treatment?
Key state programs include California Title 22, Texas 30 TAC §217, Florida Chapter 64E-6, New York 10 NYCRR Part 75, and Massachusetts 314 CMR 12.00. Additional programs cover Washington, Oregon, Pennsylvania, Illinois, and Arizona. Each sets BOD, TSS, fecal coliform, and disinfection limits summarized in the EPA 2024 State Program Status Report. See also this equipment checklist for Rawalpindi hospitals for a local-permit framing example.
What are the key parameters of wastewater treatment for clinics?
Critical clinic parameters are influent BOD5 150–400 mg/L and TSS 100–300 mg/L, with effluent targets below 30 mg/L for both. Fecal coliform must fall below 200 CFU/100mL after disinfection, with process pH near 6.5–8.5. Vermont cites 0.1 µg/L estradiol as an example pharmaceutical limit. Disinfection follows the EPA Onsite Wastewater Treatment Systems Manual (2002). Regional context is in this engineering guide for hospital wastewater treatment in Kumasi.
What are the 7 steps in clinic wastewater treatment?
The usual seven steps are screening, primary sedimentation, biological treatment (MBR or extended aeration), secondary sedimentation, disinfection with chlorine, UV, or ozone, sludge dewatering, and permitted discharge or reuse. Activated carbon or ozone polishing is added when pharmaceutical residuals must drop further. Package-plant notes such as Norweco CRPLANT.pdf describe this same sequence for sizing.
What are the standards for STP in medical facilities?
Medical facility STPs must meet EPA secondary effluent below 30 mg/L BOD and below 30 mg/L TSS, plus state disinfection limits such as fecal coliform below 200 CFU/100mL. Pharmaceutical residues are increasingly limited in California and Vermont, and PFAS rules remain under review. MBR packages are often preferred for space-constrained clinics because they combine compact footprint with reuse-grade effluent quality.
How should a small clinic size flow and disinfection?
Small clinics often produce 0.5–10 m³/h and should size for Q_peak about 2.5 times average flow on procedure days. Disinfection design commonly targets chlorine residual 1–5 mg/L, UV 40–120 mJ/cm², or ozone 0.4–2.0 mg/L for 4-log virus inactivation. Pair the hydraulic peak with a documented CT or UV dose so fecal coliform stays below 200 CFU/100mL under peak pathogen load.