Why UV Disinfection Systems Underperform: The Core Failure Logic
UV dose is the product of UV intensity and exposure time, expressed in microwatts-seconds per square centimeter. The U.S. Public Health Service benchmark for wastewater disinfection is a minimum design dose of 16,000 µW·s/cm² at a germicidal wavelength of 253.7 nm (per EPA Wastewater Technology Fact Sheet: Disinfection for Small Systems). Low-pressure mercury lamps dominate small-to-medium plants because they emit more than 85% of their output at that single 253.7 nm line, matching the DNA absorption peak of microorganisms.
Three upstream variables determine whether that 16,000 µW·s/cm² dose is actually delivered at the sensor: UV transmittance (UVT) of the water, quartz sleeve cleanliness, and lamp age/output. When any one of these drifts, delivered dose falls — and coliform counts rise — even though the lamps still strike and the HMI shows "green." Historically, a 50% UVT has been accepted as the minimum transmittance for which UV disinfection is practical; below that threshold, even a new lamp on a clean sleeve cannot meet 16,000 µW·s/cm² at reasonable flow (per EPA).
The seven problem families that follow are organized by these variables. Quartz sleeve fouling, lamp aging, low UVT, high TSS shielding, and biofilm are the three upstream variables × hydraulic and electrical modes. By locating the failure on this tree, the corrective action becomes mechanical, chemical, or pretreatment-focused rather than simply adding more lamps.
Quick-Reference: Symptoms, Root Causes, and First Actions
Every row references the 16,000 µW·s/cm² dose benchmark or the 50% UVT cutoff so this table stands alone at the panel.
| Symptom at the panel or in the lab | Likely problem family | First-action diagnostic |
|---|---|---|
| UV intensity sensor drops ≥20% from baseline with no lamp hours accumulated | Quartz sleeve fouling / scaling | Pull a sleeve, inspect for haze or orange film, check last cleaning date |
| Lamp-hour counter at or beyond 8,000–12,000 h; end-of-life lamp alarm | Lamp aging or burnout | Compare intensity to manufacturer's aging curve; plan bank replacement |
| UVT consistently below 50% per EPA cutoff; coliform fails with new lamps | Low UVT / high TSS shielding | Pull online UVT trend; review upstream TSS and color |
| Influent TSS above 30 mg/L reaching the UV channel | High TSS shielding | Check clarifier / DAF performance; verify multimedia filter backwash |
| Visible slime on reactor walls or sensor windows; recurring coliform failures | Biofilm inside reactor | Inspect channel during shutdown; shock dose upstream |
| Ballast trip alarm; lamps not striking; HMI "sensor fail" | Ballast, electrical, or sensor fault | Swap suspect ballast with known-good unit; inspect O-rings |
| Dose controller says target met but tracer study or coliform shows pockets of under-treated water | Hydraulic short-circuiting | Check influent baffles, lamp submersion, weir levels |
Quartz Sleeve Fouling, Scaling, and Iron Deposits
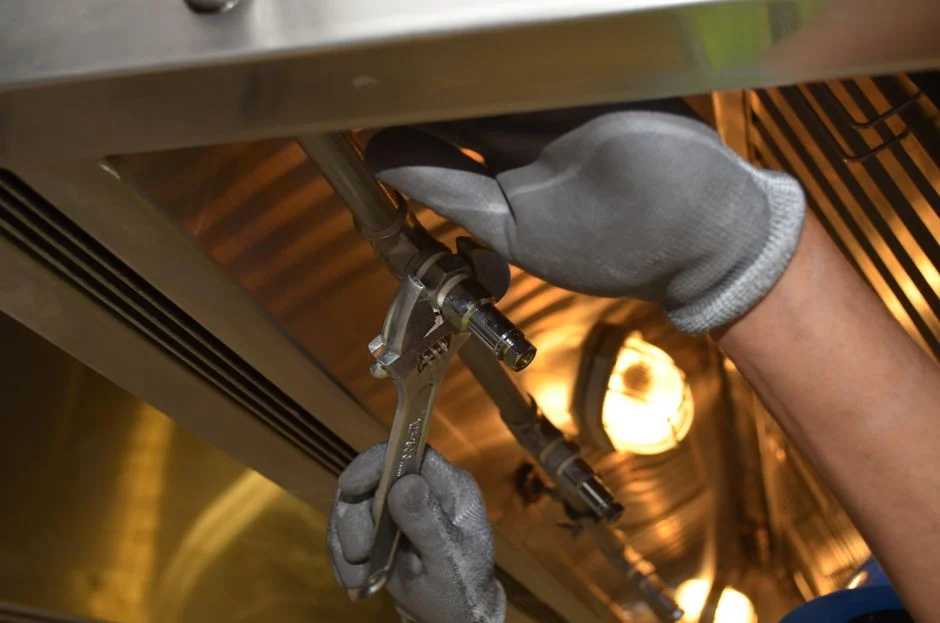
Sleeve fouling is the primary cause of lost dose in hard-water or iron-rich industrial streams. The symptom is a UV intensity sensor that trends down week-over-week with no lamp hours accumulated, paired with a visible haze, white crust, or orange-brown film on the sleeve when it is pulled for inspection. The cause is external deposition on the sleeve: calcium and magnesium scaling, iron oxide, manganese fouling, or biofilm growth on the wetted surface (per EPA Wastewater Properties matrix).
The fix is a chemical wipe with citric acid or 5–10% hydrochloric acid. Never use abrasives, as they scratch the quartz and create permanent scattering sites. Isolate the lamp, allow it to cool, remove the sleeve, and clean. Document sleeve condition with a photo for trend tracking; a sleeve that fouls in under 30 days indicates the upstream chemistry requires adjustment.
Prevention relies on upstream instrumentation and chemistry. Install an online UVT analyzer so sleeve fouling appears as a trend before it results in a coliform failure. Dose an anti-scalant upstream of the UV bank where hardness exceeds roughly 150 mg/L as CaCO₃. If cleaning intervals fall below 30 days, retrofit a mechanical wiper or automatic cleaning system.
Lamp Aging, Burnout, and Output Decline
Aged lamps look identical to new lamps to the eye but lose 15–25% of their 253.7 nm output over their service life. Symptoms are a lamp-hour counter at or beyond rated life (typically 8,000–12,000 h for low-pressure mercury lamps), UV intensity at the end-of-life point on the manufacturer's curve, and a failed-lamp indicator on the HMI. The cause is internal to the arc tube: electrode degradation, mercury depletion, or quartz darkening.
The fix is to replace lamps in full banks, not individually, to ensure the intensity profile across the reactor remains uniform. Reset the hour counter, then recalibrate the UV intensity sensor against a reference lamp per the manufacturer procedure, as sensor calibration drifts whenever the lamp population changes.
Safety callout: broken low-pressure mercury lamps can release mercury. Follow EPA-noted safety procedures and local hazardous-waste handling rules. Store spent lamps in sealed containers; do not crush them for disposal. (For broader 2026 plant-level operating costs that absorb lamp replacement, see this 2026 OPEX breakdown for municipal sewage plants.)
Low UV Transmittance and High TSS Shielding

Low UV transmittance is a failure mode that no lamp upgrade can fix. Symptoms are UVT consistently below the 50% EPA cutoff, TSS above 30 mg/L carrying through to the UV channel, and coliform failures even with new lamps and clean sleeves. The cause is dissolved organics—humic substances, dyes, phenols—and suspended colloids physically shielding bacteria from UV photons. TSS shielding is explicitly listed in the EPA Wastewater Properties table as a UV performance interference.
The fix is upstream pretreatment, not more lamp power. Add or upgrade a dissolved air flotation system for TSS and colloidal removal upstream of UV for fats, oils, and colloidal loads. Add a multi-media filter polishing step before the UV bank to strip residual TSS below 5–10 mg/L. For color and UV-absorbing organics, add activated carbon upstream. For a deeper look at where the DAF unit sits in the flow train, the DAF system process flow diagram walkthrough maps the unit operations from influent to UV bank.
Prevention involves online trend monitoring. Trend influent UVT continuously; trigger an operator alarm when UVT trends below 55% so pretreatment can be adjusted before disinfection fails. The 5% margin provides the operations team roughly 24–48 hours to correct chemistry before coliform data turns red.
Biofilm Growth Inside the UV Reactor
Biofilm is often overlooked because lamps and sleeves may appear clean while the dose is absorbed by a biological film on the reactor wall or sensor window. Symptoms are a delivered dose that drops despite clean sleeves and functional lamps, visible slime during shutdown inspection, and recurring coliform failures. The cause is microbial colonization in low-flow or shaded zones of the channel, especially in warm wastewater above 25 °C.
The fix is a planned shutdown with an upstream chlorine or peroxide shock dose, followed by a mechanical scrub of channel walls. Verify nozzle orientation and eliminate any dead legs where water can sit stagnant. Prevention requires maintaining a residual disinfectant upstream where regulations allow and running a periodic Clean-In-Place cycle if the reactor is equipped with one.
Ballast, Electrical, and Sensor Faults
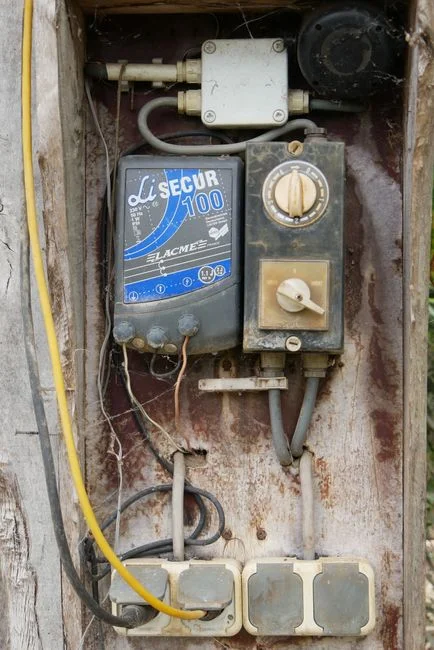
Non-process electrical issues should be ruled out before initiating lamp replacements or pretreatment modifications. Symptoms include lamps not striking, flickering, ballast trip alarms, UV sensor readings out of range, or HMI "sensor fail" alerts. Causes include ballast failure (common at end of lamp life, as the ballast sees a higher striking voltage), moisture in lamp connectors from degraded O-rings, a drifted or fouled UV intensity sensor, or power-supply issues upstream of the panel.
The fix is methodical: swap the suspect ballast with a known-good unit and confirm whether the trip follows the part. Inspect O-rings and connectors for moisture; a wet connector often manifests as an intermittent lamp strike. Clean and recalibrate the UV sensor against a reference lamp per the manufacturer procedure; do not trust a sensor that has been in service more than 12 months without verification.
Prevention is annual. A thermographic scan of the ballast panel will catch a failing ballast by its hot spot weeks before it trips. Keep at least one spare ballast of each model and one calibrated reference sensor on site to minimize downtime during a failure.
Hydraulic Short-Circuiting and Uneven Flow Distribution
Hydraulic short-circuiting is a geometric failure mode that wastes dose on bypass flow and starves the bulk, rendering it invisible from the HMI but fatal to coliform counts. Symptoms are a dose controller reporting target achievement while tracer studies or downstream coliform data show pockets of under-treated water, often correlating with peak flow events. Causes include poor influent baffling, dead zones in the channel, lamps not submerged at low flow, or level control letting water overtop the weirs.
The fix is hydraulic. Install or repair inlet baffles, verify lamp submersion at both minimum and peak flow, and add flow straighteners upstream of the bank. Prevention relies on a tracer study during commissioning and again after any flow-rate change of more than 20%.
UV Disinfection Design and Operating Parameters (Reference Table)
Keep this reference table at the electrical panel for quick consultation.
| Parameter | Target / typical value | Source / notes |
|---|---|---|
| Minimum design UV dose | 16,000 µW·s/cm² | U.S. Public Health Service, per EPA Fact Sheet |
| Germicidal wavelength | 253.7 nm | Low-pressure mercury lamp peak emission |
| Minimum practical UVT | 50% | EPA historical cutoff; alarm at 55% |
| Target TSS at UV influent | ≤ 30 mg/L, ideally ≤ 10 mg/L | EPA Wastewater Properties table; shielding effect |
| UV intensity sensor reading | Within 10% of commissioned baseline | Drift > 10% triggers recalibration |
| Low-pressure lamp life (typical) | 8,000–12,000 h | Manufacturer range; industry-typical, not regulatory |
| Sleeve cleaning interval | ≥ 30 days under normal chemistry | If < 30 days, fix upstream hardness or iron |
Preventive Maintenance Schedule That Actually Prevents Failures
Standardizing these tasks into a weekly schedule ensures consistent system performance.
- Daily: Log UV intensity, UVT if instrumented, flow rate, and lamp status from the HMI. A 5% intensity drop in a single day is a sleeve-fouling event, not a sensor glitch.
- Weekly: Conduct visual sleeve inspections on a sample of lamps; record any lamp-hour increments above 500 h to predict replacement dates.
- Quarterly: Perform a chemical clean of all sleeves; calibrate the UV sensor if its reading has drifted more than 10% from baseline.
- Annual: Replace lamps at 80% of rated life; perform a thermographic scan of ballasts; review coliform trends and dose margins against the 16,000 µW·s/cm² benchmark.
Online UVT monitoring has become cost-effective enough to be standard; a continuous signal allows operators to catch a 50%-UVT excursion before it becomes a discharge violation. Additionally, LED-UV arrays at 265–280 nm are entering municipal pilots; the dose math remains 16,000 µW·s/cm² at the target wavelength, but lamp aging is more stable and mercury handling is eliminated.
Frequently Asked Questions
What should I check first when my UV system fails a coliform test but the lamps are green on the HMI?
Frequently Asked Questions
What is the most common reason a UV disinfection system fails to meet coliform limits?
The most common cause of failure is the accumulation of mineral scale or organic fouling on the quartz sleeves, which significantly reduces the UV transmittance (UVT) of the system. This fouling prevents the required UV dose—typically 30 to 40 mJ/cm² for secondary effluent—from reaching the target microorganisms, allowing coliform bacteria to pass through the chamber untreated.
How do I know if my UV lamp needs replacing or just cleaning?
You can differentiate between these issues by monitoring the UV intensity sensor output before and after a manual cleaning cycle. If the intensity reading remains below 70-80% of the lamp's initial rated output after a thorough cleaning of the quartz sleeve, the lamp has likely reached the end of its effective service life, typically between 8,000 and 12,000 operating hours.
What UV transmittance percentage is too low for UV disinfection to work?
UV disinfection systems generally become ineffective when the UV transmittance (UVT) drops below 65% at a 254 nm wavelength. Most standard systems are engineered for a range of 85% to 95% UVT; if water quality falls below 65%, the path length of the UV light is severely restricted, necessitating a massive increase in power or specialized pretreatment to improve optical clarity.
Can UV disinfection work with high TSS, or do I need to pretreat the water first?
UV disinfection requires pretreatment if the Total Suspended Solids (TSS) concentration exceeds 10–20 mg/L. High TSS levels cause "shadowing," where bacteria are shielded from UV radiation by larger suspended particles; consequently, filtration systems like sand filters or membrane bioreactors are essential to ensure the UV light can penetrate the water column effectively.
Is UV or chlorine better for industrial wastewater disinfection in 2026?
In 2026, UV disinfection is the preferred technology for industrial applications due to the elimination of toxic disinfection byproducts (DBPs) and the absence of chemical handling risks. While chlorine remains effective for maintaining a residual in distribution piping, UV provides superior inactivation of chlorine-resistant pathogens like Cryptosporidium and Giardia without the environmental regulatory burdens associated with de-chlorination requirements.
Related Equipment
- self-cleaning and double-lamp UV sterilizers — Failures like sleeve fouling are pre-empted by self-cleaning configurations.