What 'Good' Looks Like: kWh/m³ Benchmarks for 2026
Specific energy on a modern decanter centrifuge falls in the 1.57–1.88 kWh per cubic meter of sludge when feed is held between 15 and 25 m³/h, with the lowest per-m³ value (1.57 kWh/m³ at 25 m³/h) and the highest (1.88 kWh/m³ at 15 m³/h) measured in a validated 2024 model (Dotto et al., ScienceDirect 2024). Per-m³ efficiency improves as feed rate rises toward the bowl's hydraulic limit, but the relationship is not linear—once bowl residence time shortens, cake dry solids (DS) collapses and downstream haul-off cost climbs back.
Two definitions an engineer must keep separate when reading a vendor nameplate: specific energy (kWh per m³ of sludge feed—the number that drives procurement decisions) versus drive power (kW at the motor—the number that sizes the electrical infrastructure). The Dotto paper reports recovered power ERec of 5.88 kW, 0.31 kW, and 12.10 kW at 15, 20, and 25 m³/h respectively, with the 12.10 kW value at 25 m³/h a peak tied to centrate head, not a continuous offset. The general model derived from these specific cases was validated at 18–20 m³/h with R² above 97% and RMSE of 2.59E-02 kWh/m³, providing a defensible number for tariff-based savings calculations.
The Five Levers That Move the kWh/m³ Number
Every retrofit on a decanter centrifuge targets one of five engineering variables, and the right priority order is the same on most plants: cheap, reversible, no-process-impact first; structural rebuilds last. The table below maps each lever to a typical kWh/m³ impact range, a CAPEX band, and the single most common failure mode.
| Lever | kWh/m³ impact | CAPEX band (per machine) | Key risk |
|---|---|---|---|
| VFD on main bowl motor | 5–10% reduction | $ (low) | Resonance at low Hz; verify VFD/motor pairing on legacy units |
| VFD on back-drive with braking regen | 5–12% reduction (legacy); 2–5% on already-VFD units | $$ (moderate) | Harmonics on shared bus; regen braking needs a line filter |
| Differential speed (Δn) tuning | 0–3% direct, but stabilizes cake DS — protects downstream OPEX | $ (low — control software) | Set too low → cake compaction rises, scroll torque spikes, motor trips |
| Feed rate right-sizing | 0.31 kWh/m³ gain (1.88 → 1.57) moving 15→25 m³/h | $ (instrumentation) | Polymer dose must scale linearly; under-dosing re-stabilizes the colloid |
| Hydraulic centrate recovery (Recuvane-style) | 10–30% of drive energy returned | $$$ (high — mechanical rebuild) | Pond-depth sensitivity; only stable when feed solids and centrate head are steady |
Understanding these levers allows for a systematic approach to energy optimization. Lever 1 — VFD on the main bowl motor. Matches bowl speed to actual feed solids and is the foundation of every modern decanter (Dotto et al., 2024). Without it, every downstream lever fights a fixed-speed baseline. Lever 2 — VFD-driven back-drive with braking energy recovery. This offers the largest single-digit-percent savings on legacy fixed-speed units, because the screw regenerates torque during normal deceleration that is otherwise dumped as heat. Lever 3 — Differential speed (Δn) tuning. The 2024 model shows cake DS falls as Δn rises, so energy and dryness move in opposite directions—set Δn at the lowest value that still hits target centrate clarity, then verify with a torque trace. Lever 4 — Feed rate right-sizing. Per-m³ energy falls from 1.88 to 1.57 kWh/m³ as feed rises 15→25 m³/h, but only if polymer dose scales proportionally to avoid re-stabilizing the colloid. Lever 5 — Hydraulic centrate recovery (Recuvane-style). 10–30% of drive energy is returned by selectively discharging centrate through a controlled weir (Flottweg C-series)—but the 0.31 kW ERec at 20 m³/h in the Dotto dataset warns that mid-range operating points recover much less than the headline number. Where dewatering follows thickening upstream, a well-tuned plate and frame filter press on the polishing stage can shift the cake dryness target and reduce the energy demand on the centrifuge itself.
Geometry and Pond Depth: Free Savings Already Inside the Bowl
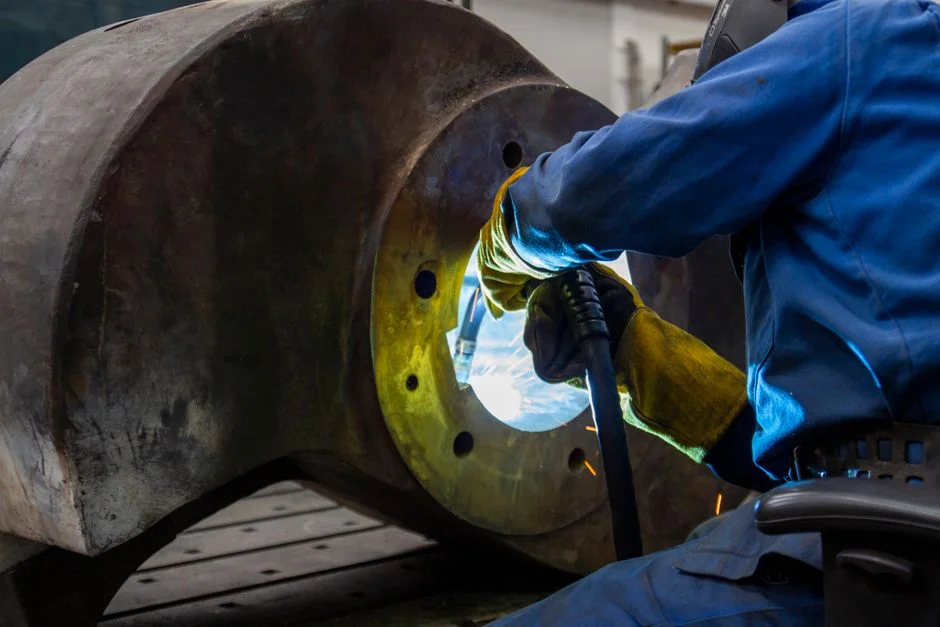
Bowl geometry and pond depth are 'free' tuning variables that do not draw a new utility connection, though they require operators to standardize the procedure rather than leaving the weir plate at a vendor-commissioned position. The Flottweg C-series uses a double-cone bowl plus a baffle plate, which shortens the scroll-to-bowl gap and raises the pressing zone, lifting cake DS without raising bowl speed. Independent bowl and scroll VFDs (Simp-Drive) make the geometry usable, because the operator can hold Δn constant while changing pond depth.
Deeper pond raises clarification performance but reduces recoverable centrate head—there is a direct trade-off with hydraulic recovery, and a plant running a Recuvane-style retrofit at maximum pond depth is leaving recovered energy on the table. Weir plates in the bowl cover are adjustable; standardize a quarterly pond-depth check tied to feed solids (not a fixed setpoint), and re-tune whenever influent DS shifts more than ±0.5 points. Geometry-driven DS gains feed back into OPEX: a 2-point DS rise from 23% to 25% cuts sludge volume by approximately 8% (Flottweg), so even a no-energy-change retrofit can pay back through haul-off, disposal, and transport. Plants that already run a downstream high-efficiency sedimentation tank upstream of the centrifuge typically see a tighter feed-solids envelope, which facilitates pond-depth optimization.
How Much Each Retrofit Actually Saves: CAPEX, OPEX, and Payback
The five levers above are not equally attractive on a dollars-per-kWh-saved basis, and stacking them in the wrong order is a common procurement mistake. The table below ranks each retrofit by the kWh-saved-per-dollar figure that a 2026 plant engineer should quote to procurement, alongside a payback trigger condition.
| Retrofit | kWh saved per $1,000 CAPEX (typical) | Payback trigger | Implementation note |
|---|---|---|---|
| VFD on bowl motor | 8–15 kWh/yr per $1,000 | Unit runs >4,000 h/yr | Lowest CAPEX, lowest risk; baseline for any other retrofit |
| VFD back-drive with regen | 5–10 kWh/yr per $1,000 | Frequent start/stop cycles per shift | Pair with line filter to control harmonics on shared bus |
| Feed rate instrumentation + Δn tuning | 10–18 kWh/yr per $1,000 | Variable feed throughout the day | Often <18 month payback; no mechanical rebuild |
| Polymer automation (torque feedback) | Not a kWh lever | Polymer spend >15% of centrifuge OPEX | Coupled OPEX win; protects downstream cake dryness |
| Hydraulic centrate recovery | 2–6 kWh/yr per $1,000 | Stable feed solids ±0.5 pts | Highest CAPEX; only when pond depth and feed composition are stable |
The sequence that survives a tariff-based audit is: VFD on bowl → Δn + feed rate tuning → VFD on back-drive with regen → polymer automation → hydraulic centrate recovery. VFD and hydraulic recovery should not be stacked on the same machine before Δn is re-tuned, because a re-tuned bowl that lowers ERec headroom will reduce the centrate-recovery pay-off in the first year. An automatic polymer dosing system tied to scroll-torque feedback is not a kWh/m³ lever, but it consistently lowers polymer dose by 10–20% in field retrofits (HydropureWater field data, 2026) and protects the DS that the energy retrofits are trying to buy.
Worked Example: Cutting kWh/m³ on a 20 m³/h Sludge Line
Take a single decanter running two-shift duty (~4,000 h/yr) on thickened waste-activated sludge at 20 m³/h, with a baseline of 1.76 kWh/m³ (Dotto et al., 2024)—annual electrical draw ≈ 140,800 kWh. The retrofit sequence follows the priority order defined above.
- Step 1 — VFD on back-drive with regen. A conservative 8% reduction on a legacy unit drops consumption to ~1.62 kWh/m³, saving ~12,800 kWh/yr.
- Step 2 — Hydraulic centrate recovery at 10% (lower end). Returns ~10% of drive energy per Flottweg, adding ~14,000 kWh/yr on top of Step 1.
- Step 3 — Tighten Δn to raise DS from 23% to 25%. Adds ~0.03 kWh/m³ of specific energy (a small re-investment) but cuts haul-off volume by ~8% (Flottweg).
- Result. ~27,000 kWh/yr of electrical savings at the lower end of the recovery range, plus 8% volume reduction on disposal. At an industrial tariff of $0.10/kWh, the electrical saving alone is ~$2,700/yr per machine; combined with haul-off, total payback lands in 14–24 months.
This example holds provided polymer dose scales with feed rate and the pond-depth check is on the maintenance schedule.
Operating Pitfalls That Quietly Inflate kWh/m³
Bad operating practice can erase the gains from every retrofit listed above, and the four items below are the ones a 2026 plant engineer should treat as a pre-retrofit checklist. Overdosing polymer raises centrate viscosity and forces higher bowl speed to recover DS, which directly inflates kWh/m³. Running bowl at full speed regardless of feed solids wastes power during low-loading hours and is the single most common reason a "VFD-equipped" decanter still bills at fixed-speed energy. Ignoring wear on scroll flights raises Δn demand for the same DS, pushing specific energy up while degrading cake. Leaving pond depth at the commissioning setpoint means the operator is not capturing either clarification or hydraulic-recovery gains. Foam carryover from upstream biology is a related failure mode that destabilizes the feed envelope; the 2026 wastewater foam control guide covers the upstream side.
Frequently Asked Questions
What is a typical specific-energy number for a decanter centrifuge in 2026?
A modern decanter centrifuge runs 1.57–1.88 kWh/m³ across a 15–25 m³/h feed window, with 1.76 kWh/m³ at the 20 m³/h mid-point (Dotto et al., ScienceDirect 2024). The number is a function of feed rate, bowl speed, and differential speed; it is not a single point on a nameplate.
Do I need a VFD on both the main bowl motor and the back-drive?
On current-generation machines, yes—VFD on both the main bowl motor and the back-drive (screw) is now standard, and the back-drive is what enables braking energy recovery. Fixed-speed legacy units see the largest single retrofit gain from a back-drive VFD, because the legacy back-drive dissipates its deceleration energy as heat
Frequently Asked Questions
How much energy does a decanter centrifuge use per cubic meter of sludge?
Energy consumption for decanter centrifuges typically ranges from 0.8 to 2.5 kWh per cubic meter of processed sludge. This variance depends heavily on the solids concentration of the feed, the required cake dryness, and the specific gravity of the sludge particles.
Can a VFD retrofit on a decanter centrifuge really cut kWh per m3?
Yes, retrofitting a Variable Frequency Drive (VFD) can reduce energy consumption by 15% to 30% by eliminating the high-torque, across-the-line starting currents and enabling precise speed control based on real-time process load. By optimizing the bowl speed to the minimum required for separation, operators avoid the unnecessary energy waste associated with running at fixed maximum rated speeds.
What is a back-drive on a decanter centrifuge and how does it recover energy?
A back-drive system, often utilizing a regenerative VFD, controls the speed difference between the bowl and the scroll conveyor. During operation, the scroll often acts as a brake; a regenerative back-drive captures this mechanical braking energy and converts it back into electrical energy, which can then be fed back into the centrifuge's main drive bus or the facility's power grid.
How much energy does a Recuvane-style centrate recovery actually save?
Recuvane-style systems, which utilize the kinetic energy of the centrate discharge, can reduce the total power consumption of the centrifuge by approximately 5% to 10%. By using an impeller to harness the high-velocity centrate exiting the bowl, the system recovers energy that would otherwise be lost as turbulence and friction in the discharge housing.
Does lowering differential speed save energy or just change cake dryness?
Lowering the differential speed between the bowl and the scroll primarily serves to increase cake dryness by extending the solids retention time, but it also provides a direct energy benefit by reducing the torque load on the scroll drive motor. Lower torque requirements result in a measurable decrease in electrical current draw, effectively lowering the total power demand of the conveyor drive system.