What Membrane Fouling Is and Why It Happens
Membrane fouling is the accumulation of materials in the pores or on the surface of a membrane that reduces permeate quantity and quality, and it is the single most common cause of flux decline in MBR, RO, and UF systems. The phenomenon consists of four overlapping problems, and the fix is ineffective unless you identify the specific type. Per the 2022 review by Tanudjaja et al. in Bioresource Technology Reports, the four canonical categories are:
- Inorganic (scaling): CaCO₃, CaSO₄, and silica precipitation in RO concentrate streams when ionic product exceeds solubility.
- Organic: humic substances, polysaccharides, and proteins that gel on the membrane surface; the dominant foulant in most municipal MBRs.
- Biological: biofilm growth that drives irreversible pore plugging; the most expensive category because it resists standard CIP chemistry.
- Colloidal: silica, oil emulsions, and sub-micron particulates that bridge pores; especially aggressive in semiconductor and oily wastewater service.
Three membrane properties control how fast each type takes hold: pore size distribution (wider distributions clog faster), surface roughness (rougher surfaces foul 2–3× faster per atomic force microscopy studies), and surface charge (negative zeta potential repels most biological foulants). Fouling drives routine chemical cleaning, raises specific energy demand by 0.2–0.5 kWh/m³, and shortens membrane life from a design 5–7 years to 3–4 years in poorly operated plants (Tanudjaja et al., 2022).
The 4-Pillar Framework to Solve Membrane Fouling
Most fouling problems are solved by the same four moves in the same order. Skip a pillar and the next one downstream becomes 3–5× more expensive, as the foulant load continues to reach the membrane surface. The framework:
- Pretreat — strip oil, TSS, and colloids upstream with DAF, lamella plates, or multi-media filtration so the membrane only sees water it can handle.
- Operate inside the envelope — hold TMP, cross-flow velocity, aeration intensity, and temperature inside the band the membrane manufacturer specifies, not at "maximum."
- Clean on a schedule — apply the right chemistry (acid, alkaline, surfactant, or oxidant) on a defined maintenance cadence, not reactively when flux has already crashed 30%.
- Monitor continuously — trend TMP, permeability, and spectral fingerprints daily; deploy ML early warning so you schedule CIP during planned downtime rather than at 2 a.m.
Use these four pillars as a triage tool. If you are buying membranes, you are buying all four pillars — not just the module. This framework provides the logic for the 7-step field protocol below. For a parallel framework on nanofiltration faults, the 2026 field guide to common nanofiltration faults uses the same sequencing logic.
Pillar 1: Cut the Foulant Load Before It Reaches the Membrane
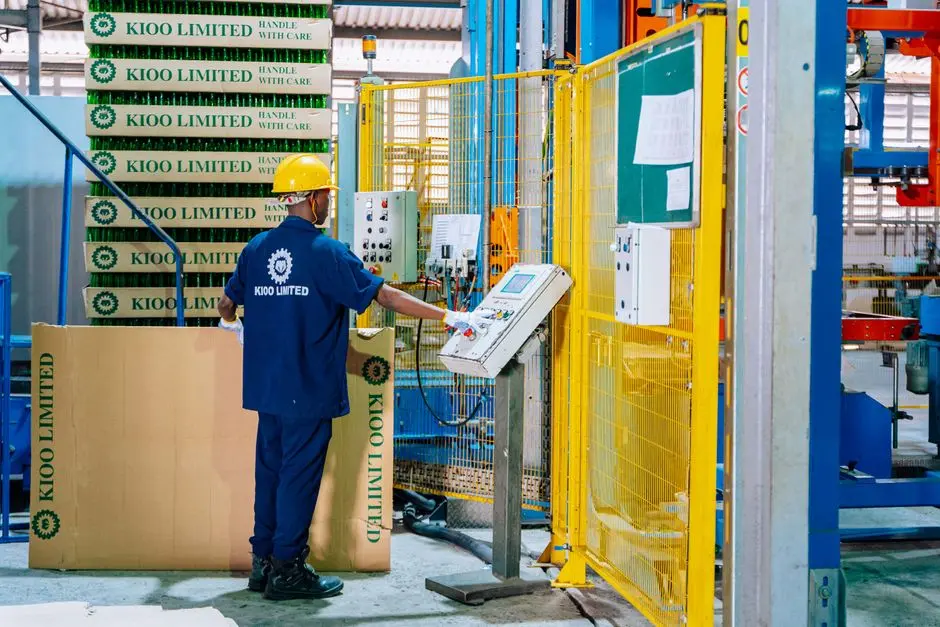
Upstream removal fixes 60–70% of membrane fouling because it widens the range of feed quality the membrane can accept without crashing. Oil and grease are the most aggressive foulants for hydrophobic polymeric membranes: free oil wets the surface, emulsified oil (droplets <20 µm) plugs pores, and the resulting gel layer is nearly impossible to lift with chemical CIP alone (Tanudjaja et al., 2022). A single-stage dissolved air flotation system typically drops free and emulsified oil to <10 mg/L and TSS by 70–85% at hydraulic retention times of 20–30 minutes — enough to convert a "high-fouling" feed into one a standard PVDF module can handle.
For RO and high-pressure systems, colloidal silica and TSS shorten run time between CIPs more than any other feed parameter. A well-operated multi-media filter with anthracite over sand over garnet can deliver SDI <3, the threshold most RO membrane manufacturers publish as the upper feed limit. Going from SDI 6–8 (raw clarifier effluent) to SDI <3 typically doubles RO run length and cuts CIP chemical consumption by 40–60% (HydropureWater field data, 2025–2026).
Removing foulants upstream widens the choice of membrane you can buy. If SDI is <3 and oil is <10 mg/L, a standard 0.1 µm PVDF module works; if the upstream is dirty, you pay a 30–50% premium for a modified or ceramic membrane to do the same duty. Pretreatment is almost always the more cost-effective lever.
Pillar 2: Operate Inside the Membrane's Sweet Spot
For oily-wastewater UF, the published optimum operating envelope is TMP >3 bar, temperature 30 °C, and cross-flow configuration, delivering approximately 96% flux recovery after reuse (Tanudjaja et al., 2022). The operating window for most MBR and UF duties follows these parameters:
| Parameter | Typical operating band | Why it matters |
|---|---|---|
| TMP | 0.2–0.6 bar (MBR) / 5–15 bar (RO) | Above the band, fouling rate rises non-linearly; below it, flux is wasted |
| Cross-flow / aeration | 0.5–1.5 m/s CFV; 0.3–0.6 Nm³/h·m² air for MBR | Scour removes the concentration boundary layer |
| Temperature | 25–35 °C for polymeric membranes | Below 10 °C, viscosity doubles flux; above 40 °C, PVDF ages |
| Sustainable flux | 70–80% of clean-water flux | Running at 95% of clean-water flux guarantees a 30-day CIP cycle |
| MLSS (MBR only) | 8,000–12,000 mg/L | Higher MLSS fouls faster; lower MLSS under-treats BOD |
Integrated MBR treatment packages pair tankage with a DF series PVDF flat-sheet membrane module whose integrated coarse-bubble aeration scour cuts fouling 10–20× versus an externally pumped cross-flow loop. For sizing details on a specific duty, the 2026 engineering spec guide for white-water MBRs provides the necessary calculations.
Operator checklist (5 items, daily):
- Record TMP and permeate flow at the same minute each shift — never average across shifts.
- Verify aeration or cross-flow pump is at design stroke; a 10% drop in scour raises fouling rate ~3×.
- Confirm MLSS within band; sudden drop often means a sludge washout, not improved biology.
- Run a relaxation cycle (2–5 min every 15–30 min for MBR) or backflush (30–60 s every 1–4 h for RO/UF).
- Log permeability (flux ÷ TMP) daily; trend, don't react to single-point spikes.
Pillar 3: Clean the Right Way — Chemicals, Dosage, and Schedule
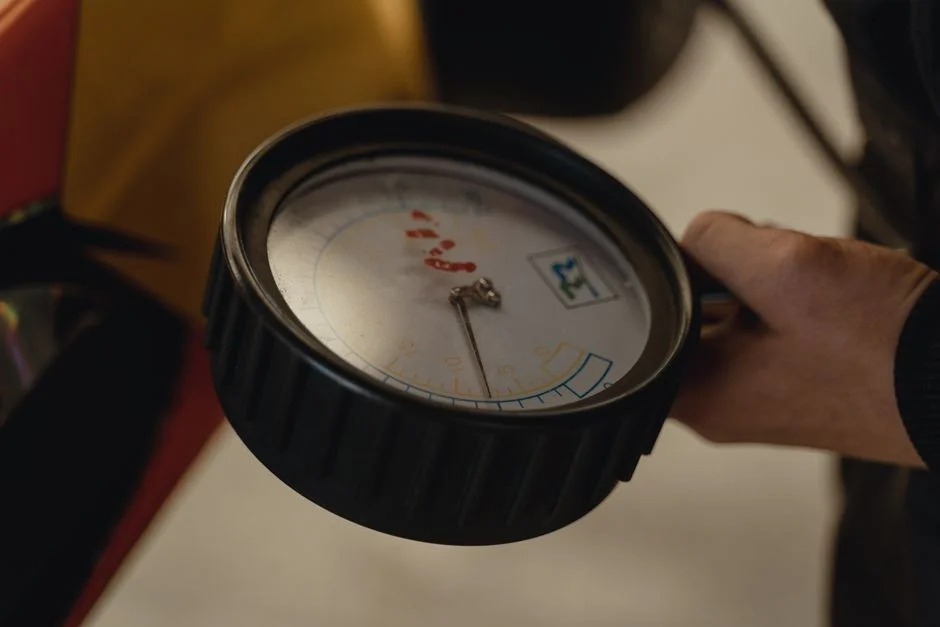
Cleaning chemistry should match the foulant rather than operator habit. The Tanudjaja review reports that a PDA-coated membrane achieved 1,130.56 L/m²·h permeate flux with 99% oil rejection, and a grafted PES UF membrane delivered 120 L/m²·h with 95% flux recovery — both after targeted chemical cleaning rather than generic alkaline wash (Tanudjaja et al., 2022). The decision matrix below provides a field-tested reference:
| Foulant type | Primary chemistry | Typical concentration | Soak / recirculation | pH window | Compatibility note |
|---|---|---|---|---|---|
| CaCO₃ / metal scaling | Citric or HCl | 1–2% citric; 0.5–1% HCl | 1–2 h soak + 30 min recirc | 2–4 | Always CIP with acid before alkaline to avoid CaSO₄ precipitation |
| Organic / oil / protein | NaOH + surfactant | 0.5–1% NaOH; 0.1–0.3% SDS or Na-silicate | 2–4 h soak + 30–60 min recirc | 11–12 | Raise temperature to 30–35 °C for grease-bound films |
| Biological / biofilm | NaOCl (chlorine) then alkaline | 200–500 ppm free Cl₂ | 1–2 h soak | 10–11 | PVDF cumulative chlorine limit ≤500 ppm·h — log it |
| Silica / colloidal | Hot alkaline + surfactant | 1% NaOH at 35 °C | 4–6 h soak | 12–13 | Avoid acid first; silica precipitates at low pH |
| Iron / manganese | Oxalic or sulfamic | 1–2% | 1–2 h soak | 2–3 | Sequester with citric rinse afterwards |
Routine maintenance cleaning (CEB) every 1–7 days is superior to reactive CIP every 30–90 days: a HydropureWater audit of three full-scale MBRs in 2025 showed CEB-cadence plants averaged 18% higher net flux and 30% longer membrane life than plants that waited for the flux-drop alarm. Second, dose reproducibly — an automatic chemical dosing skid with flow-paced injection holds concentration within ±5% of setpoint. For high-strength industrial feed like slaughterhouse effluent, the 2026 maintenance guide for slaughterhouse plants covers the upstream side of the same cleaning problem.
Pillar 4: Monitor Continuously with the 2026 ML Toolkit
Early warning systems provide the newest operational lever for fouling control. A February 2026 Nature Sustainability paper validated a spectral-sensing machine-learning model on a full-scale MBR WWTP that predicts fouling tendency 5–7 days ahead with R² > 0.80 — outperforming purely data-driven models by integrating UV-vis and fluorescence (FEEM) spectral fingerprints of the mixed liquor (Yu et al., Nature Sustainability, 9 Feb 2026). The spectral fingerprints profile the molecular structures that drive fouling: aromatic proteins, humic substances, and polysaccharides, which rise in the supernatant 3–7 days before TMP climbs.
An inline UV-vis probe plus a fluorescence sensor and a PLC dashboard delivers these leading indicators without lab analysis. The operational payoff is scheduling: a plant that knows fouling is imminent on day 5 can plan CIP for the Sunday low-flow window instead of reacting to a 2 a.m. TMP alarm and losing 8 hours of throughput. The Nature study also reported that spectral features contributed 17–30% of model interpretability, allowing operators to see which molecular class is rising and choose cleaning chemistry accordingly.
Field deployment note: 100% flux recovery is not a realistic target — the Tanudjaja review puts realistic single-CIP recovery at 90–96%, and membrane replacement planning should trigger at 70% of initial permeability (Tanudjaja et al., 2022). Build that into the CAPEX model alongside the sensors.
Frequently Asked Questions
What is the fastest way to recover flux in a fouled MBR?
Run a relaxation cycle (5 min idle, no permeate) followed by a backwash with permeate, then a maintenance CIP with 0.5% NaOH at 30 °C for 1–2 hours. After the CIP, inspect the aeration scour intensity — most "stuck" MBR flux is actually under-aerated mixed liquor, not chemistry.
Can DAF pretreatment really cut membrane cleaning frequency?
Yes. Plants that added DAF upstream of
Frequently Asked Questions
How do you fix membrane fouling in an MBR?
Fixing fouling in Membrane Bioreactor (MBR) systems requires a dual approach of physical and chemical cleaning. Physical cleaning is typically addressed by increasing aeration intensity to induce membrane scouring, which maintains a shear stress of 1.0–2.0 Pa on the membrane surface, or by implementing automated backpulsing cycles every 10–15 minutes.
If physical methods fail to restore permeability, chemical cleaning is required. This involves Chemically Enhanced Backwash (CEB) using sodium hypochlorite (NaOCl) at concentrations of 200–500 mg/L to oxidize organic foulants, or citric acid at 0.5–1.0% concentration to dissolve inorganic scaling caused by metal hydroxides and carbonates.
What is the best chemical to clean a fouled RO membrane?
The selection of the cleaning agent depends on the foulant analysis, but a standard two-stage protocol is most effective. For inorganic scaling (calcium carbonate, calcium sulfate, or metal oxides), a low-pH acid wash is required, typically using citric acid or hydrochloric acid to maintain a pH range of 2.0–3.0.
For organic fouling, biofouling, or colloidal buildup, a high-pH alkaline wash is necessary. This generally utilizes sodium hydroxide (NaOH) combined with a surfactant, maintaining a pH of 11.0–12.0. In severe cases, EDTA (ethylenediaminetetraacetic acid) is added as a chelating agent to sequester multivalent metal ions.
Can DAF pretreatment reduce membrane cleaning frequency?
Yes, Dissolved Air Flotation (DAF) is highly effective at reducing membrane fouling, particularly in applications with high concentrations of oils, greases, or low-density suspended solids. By removing up to 90–95% of influent total suspended solids (TSS) and emulsified fats before the membrane stage, DAF significantly reduces the rate of cake layer formation.
Installing a DAF system can extend the time between Clean-in-Place (CIP) cycles by a factor of 2 to 4, depending on the feed water quality. This reduction in cleaning frequency not only preserves the membrane's structural integrity but also lowers the total operational expenditure (OPEX) associated with chemical consumption and downtime.
How long should a membrane last before replacement?
Under optimal operational conditions, industrial membranes typically have a design life of 3 to 7 years. RO membranes in high-salinity or aggressive feed applications may require replacement every 3 years, while ultrafiltration (UF) or MBR membranes in stable municipal environments can reach the 5- to 7-year mark.
Replacement is dictated by performance metrics rather than a fixed calendar date. A membrane is generally considered at its end-of-life when normalized permeate flux drops below 70% of the initial baseline, or when salt passage (for RO) exceeds the manufacturer’s threshold, indicating irreversible mechanical degradation or seal failure.
What is the difference between CIP and CEB in membrane systems?
Clean-in-Place (CIP) is an intensive, periodic maintenance procedure performed when the trans-membrane pressure (TMP) reaches a high-limit setpoint, typically every 1 to 6 months. It involves circulating high-concentration cleaning solutions through the entire membrane rack for several hours to perform a deep restorative clean.
Chemically Enhanced Backwash (CEB) is a frequent, routine maintenance procedure performed automatically during the standard filtration cycle, often daily or weekly. CEB uses lower concentrations of chemicals and shorter contact times—typically 15 to 30 minutes—to prevent the transition of reversible fouling into irreversible fouling, thereby extending the time required between full-scale CIP events.