Why Sludge Foaming Happens in Aeration Tanks and MBRs
Operators solve sludge foaming by separating biological from chemical foam, then correcting filament drivers. High SRT above 6–10 days without nitrification need, F:M below 0.1 kg BOD/kg MLVSS·d, DO under 1.5–2.0 mg/L in aerobic zones, and influent FOG above 50–100 mg/L raise risk when two or more coincide. Confirm cause with microscopy and a 1–10 mg/L antifoam tracer before dosing.
Foaming in activated-sludge and MBR systems is gas-bubble accumulation — typically air or CO2 — stabilized by surface-active material. Drivers include biosurfactants from filamentous organisms, FOG, and synthetic detergents (Bitton, 2005, Chapter 9). A two- to ten-centimeter foam blanket is normal; a 30-cm chocolate-colored layer climbing the walkway is not. Operators who skip that visual threshold waste time chasing antifoam when the blanket is still normal.
The visible foam falls into two distinct populations, and recognizing which one you have drives the rest of the response. Biological foam is thick, tan to dark brown, stable for hours, and can climb tank walls and weirs. It carries a musty or earthy odor and is driven by filamentous organisms such as Nocardia spp. and Microthrix parvicella. Chemical foam is white, fast-dispersing, often smells of detergent or hydrocarbon, and typically appears within minutes of a CIP, surfactant batch, or slug FOG discharge.
Per the standard operator manual (Jenkins, Richard & Daigger, Lewis Publishers, 3rd Ed., 2003), four operational factors correlate with foaming events. Those factors are high SRT, low F:M ratio, low dissolved oxygen in the aerobic zone, and elevated FOG or surfactant loading. When two or more of these line up, the probability of a foam episode rises sharply.
MBR plants add a structural twist. Submerged membrane modules reject floated biomass and foam fragments back into the mixed liquor, so foam-forming organisms accumulate in the tank rather than washing out with the effluent (Bitton, 2005). That recycle means MBR reactors can hold a self-reinforcing foam layer that conventional activated-sludge systems would partially bleed off through the secondary clarifier. Keep this in mind when specifying a new MBR membrane bioreactor wastewater treatment system or retrofitting an existing one. Most plants we size for industrial reuse run SRT long enough that Microthrix pressure is already built in unless FOG and F:M stay controlled.
Biological vs Chemical Foaming: A Two-Minute Triage
Biological foam and chemical foam demand different first moves, so the foam-type call is the fastest decision an operator can make. A stable brown sticky foam that survives a spray nozzle and leaves a brown weir ring is biological. A transient white lathery foam after a CIP event or surfactant batch is chemical. Mixed cases are common — a food plant with chronic FOG loading can push biology into a high-SRT Nocardia regime that looks chemical at the surface but is a biological bloom.
The organisms behind biological foam are well characterized. Nocardia spp. are Gram-positive, branching, and form a stiff brown foam with a high lipid content. Microthrix parvicella is a long, coiled, Gram-positive filament that thrives in long-SRT, low-F:M systems, especially in cold mixed liquor. Type 0092 and Type 0041 are recognized filamentous morphotypes in the Eikelboom classification. Candidatus 'Microthrix' refers to a closely related lineage now treated as distinct from classical M. parvicella (Bitton, 2005; Jenkins et al., 3rd Ed.). Chemical foam triggers are equally well documented: laundry-style surfactants, CIP residue with nonionic or anionic detergents, petroleum hydrocarbons from refinery wastewater, and FOG from food, dairy, or slaughterhouse operations.
| Feature | Biological Foam | Chemical Foam |
|---|---|---|
| Color | Tan, chocolate, brown | White, off-white, occasionally iridescent |
| Stability | Persists for hours; survives spray | Drains in minutes; collapses with water |
| Odor | Musty, earthy, biological | Detergent, solvent, hydrocarbon |
| Location | Aeration tank surface, secondary clarifier, MBR chamber | Often appears downstream of a specific feed point or CIP |
| Dominant cause | Filamentous bacteria (Nocardia, Microthrix parvicella, type 0092, type 0041) | Surfactants, FOG, hydrocarbons, cleaning agents |
| Time signature | Builds over days to weeks | Spikes within minutes of a discharge |
| Antifoam response | Little or no collapse | Collapses within 1–5 minutes |
How Operators Solve Sludge Foaming: Four-Step Diagnostics
Diagnostic workflows for sludge foaming stall when the crew jumps to a chemical fix before confirming the cause. A reproducible four-step sequence — visual, microscopic, parameter, tracer — produces a defensible root cause in under an hour. That record also gives the process engineer something solid to put in front of a regulator. Keep this sequence on the board whenever foam climbs the walkway again.
Step 1 — Visual and odor ID. Note foam color, thickness, stability under a spray, and exact location (aeration tank vs secondary clarifier vs MBR chamber). Brown foam confined to the aerobic zone of a plug-flow reactor is almost always biological. White foam at the head of an equalization basin after a CIP is almost always chemical. Photograph the foam against a white clipboard and timestamp the image; trend photos over a week will show whether the cause is a recurring upstream event or a slow biomass shift.
Step 2 — Microscopic examination at 100×. Pull a fresh mixed-liquor grab sample and prepare a wet mount. Identify the dominant filamentous morphotype with the Jenkins, Richard & Daigger manual (Lewis Publishers, 3rd Ed.) and the Microscopic Sludge Investigation Manual cited in the Bitton chapter. Gram-positive, branching, short filaments (<10 µm diameter) signal Nocardia. Long, coiled, Gram-positive trichomes without branching signal Microthrix parvicella. Tightly coiled, Gram-negative filaments suggest type 021N. Note the filament index: a dominant filament exceeding 3–5 on a 0–6 scale is consistent with foaming risk.
Step 3 — Process parameter check. Pull SRT, F:M, MLSS, DO, temperature, FOG, and surface tension from the SCADA historian. Flag any of the high-risk ranges shown in the table below. One parameter out of range is a warning; two or more is the probable cause of a biological bloom (Jenkins et al., 3rd Ed.).
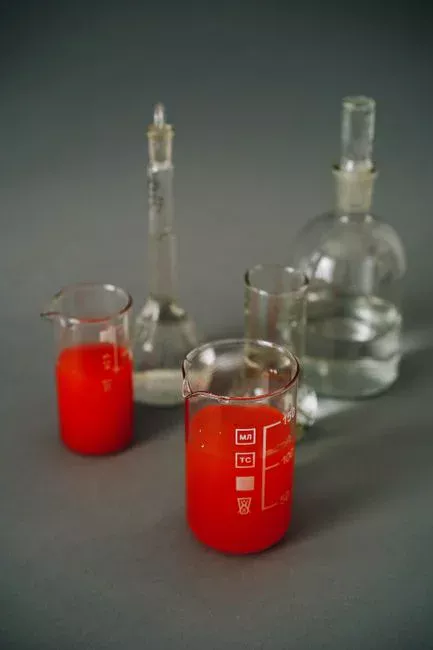
Step 4 — Antifoam tracer test. Dose 1–10 mg/L of a silicone or polyalkylene-glycol antifoam to a small foam-laden sample in a beaker and observe for 5 minutes. If the foam collapses cleanly, surface tension is the driver and the cause is chemical or FOG-related. If the foam is unchanged, the cause is biological and basin-scale antifoam is a waste of money. Most plants we size for food wastewater run this beaker test before any basin-wide dose.
| Parameter | High-risk range for biological foaming | Operator action |
|---|---|---|
| SRT | > 6–10 days (without nitrification need); > 10–15 days at low F:M | Reduce wasting or increase MLSS draw to target 3–5 days if nitrification is not required |
| F:M ratio | < 0.1 kg BOD/kg MLVSS·d | Increase carbon feed or reduce wasting to push F:M above 0.2 |
| Dissolved oxygen | < 1.5–2.0 mg/L in aerobic zone | Raise DO setpoint; check air-grid pressure and diffuser fouling |
| FOG in influent | > 50–100 mg/L routinely | Install or optimize upstream DAF pretreatment for food and beverage plants |
| MLSS | > 4,000–5,000 mg/L with rising SVI | Increase wasting; verify sludge settleability |
| Surface tension | < 50 mN/m | Confirms surfactant or FOG contribution |
Control Methods Compared: Physical, Chemical, Operational, Biological
Control method selection after cause confirmation should weigh speed, cost, and whether upstream operations are within your reach. Most plants end up combining two or three methods; very few foam events are solved by a single lever.
Physical controls include spray nozzles, water-lance knock-down, mechanical skimmers, and surface overflow weirs. They are cheap, immediate, and treat only the symptom. Foam biomass recycled to the head of the plant can re-foam or break through to the secondary clarifier. Use physical methods to keep walkways safe while longer-term fixes are implemented.
Chemical controls use silicone emulsions, polyalkylene-glycol, fatty-alcohol, and stearate-based antifoams at typical doses of 1–10 mg/L. They are fast-acting but expensive at scale, can depress dissolved oxygen in the aeration basin, and can foul downstream DAF or membrane processes if overdosed. In MBR plants, silicone antifoam can deposit on PVDF membranes and shorten cleaning intervals. Chemical antifoam in MBR service is therefore a last resort rather than a routine fix (HydropureWater field data, 2025).
Operational controls address the root cause by changing how the basin is run. Trimming SRT to 3–5 days typically resolves Nocardia foaming within 1–3 SRT cycles but sacrifices nitrification, so a parallel plan to maintain ammonia compliance is required. Raising DO above 2 mg/L, increasing F:M above 0.2 by adjusting wasting, and installing upstream FOG removal are the most defensible long-term moves (Jenkins et al., 3rd Ed.). For facilities where the foam is tied to influent FOG, an engineered dissolved air flotation (DAF) system at the headworks is the single highest-leverage intervention.
Biological controls use bioaugmentation with non-foam-forming bacterial consortia designed to outcompete Nocardia and Microthrix parvicella for substrate. Published practice treats this as a multi-week strategy rather than an emergency measure; it works best when SRT, DO, and FOG are already in target ranges. In MBR service, biological control is preferred over silicone antifoam because it does not foul the membrane. That preference matters when integrating controls into an existing MBR flat sheet membrane module train.
| Method | Onset | Cost | Addresses root cause? | MBR compatibility | Defensible to regulators? |
|---|---|---|---|---|---|
| Physical (spray, skimmer, weir) | Immediate | Low | No | Compatible | Limited — symptom only |
| Chemical antifoam (silicone, PAG, fatty-alcohol) | Minutes | Medium–high | No | Silicone: poor; PAG/fatty-alcohol: acceptable | Yes, with dose logs |
| Operational (SRT, DO, F:M, FOG removal) | 1–3 SRT cycles | Low–medium | Yes | Compatible | Strong — preferred regulatory narrative |
| Biological (bioaugmentation) | 2–6 weeks | Medium | Yes (partial) | Preferred | Yes, when paired with operational changes |
Case Examples: Food Processing, Petrochemical, and MBR Plants
Food processing / slaughterhouse. A mid-sized poultry processor runs a conventional activated-sludge system at SRT 12 days, F:M 0.08, and DO 1.4 mg/L; influent FOG averages 180 mg/L. The basin develops a thick chocolate foam within six weeks. Microscopy shows a dominant Nocardia population. The fix is engineered: a DAF unit at the headworks drops FOG to under 30 mg/L, SRT is trimmed to 5 days during the abatement phase, and DO is raised to 2.2 mg/L. Foam is gone within two SRT cycles (HydropureWater field data, 2025). Plants designing around this scenario should review proven DAF pretreatment for food and beverage plants configurations.
Petrochemical / refinery. A refinery wastewater plant reports white, transient foam that spikes within 30 minutes of each CIP cycle at the launder pad. Microscopy shows normal filament diversity; the antifoam tracer test collapses the foam in under two minutes. Cause is nonionic surfactant from the CIP formulation, not biology. Fix is source-side: switch the launder pad to a low-foam CIP detergent, install equalization upstream, and apply silicone antifoam at the equalization basin as a stopgap.
MBR municipal / industrial reuse. A 20,000 m³/d MBR running SRT 18 days for nutrient removal develops persistent brown foam over the membrane cassette. Microscopy shows Microthrix parvicella as the dominant filament. Silicone antifoam was tried first and accelerated membrane fouling, with transmembrane pressure rising 18% within 10 days. The plant switched to polyalkylene-glycol antifoam at 3 mg/L as a short-term measure, then layered in bioaugmentation and SRT correction. Foam suppression held at 4-week follow-up (HydropureWater field data, 2025). For operators planning capacity, the controls and instrumentation layout for similar trains is detailed in our MBR process flow diagram.
Prevention Checklist and Long-Term Control
Foam prevention costs less than emergency suppression once filament index and FOG loading are already high. Audit the checklist below monthly against documented operating ranges (Jenkins et al., 3rd Ed.; Bitton, 2005):
- Maintain SRT at 3–5 days for conventional plug-flow; 8–12 days only when nitrification is required and F:M is held above 0.1.
- Keep DO above 2.0 mg/L in aerobic zones; alarm at 1.5 mg/L.
- Install or optimize FOG removal (DAF) at the headworks if influent FOG routinely exceeds 50 mg/L.
- Quarterly microscopic filament ID to catch Nocardia and Microthrix parvicella before they bloom.
- In MBR service, avoid silicone antifoam; use polyalkylene-glycol or fatty-alcohol types and dose at 1–5 mg/L only as a stopgap.
- Track foam thickness, color, and location on the daily operator log; trend weekly.
- Verify dewatering performance downstream — chronic biological foam often shows up as elevated bound moisture in the cake from your Plate and Frame Filter Press for Sludge Dewatering, and fixing the upstream biology usually improves dewatering too.
Who This Is For and Next Step
Plant engineers and operators running activated-sludge or MBR trains with recurring brown foam, rising filament index, or FOG above 50 mg/L will get the most from this workflow. EPC teams specifying headworks DAF ahead of long-SRT MBR trains should use the same triage before locking SRT and wasting setpoints. Facilities with only occasional white foam after CIP may need source-side detergent changes more than a basin redesign.
If your site needs equipment sizing for DAF pretreatment, MBR retrofit, or sludge dewatering after foam control, send influent FOG, SRT, DO, and filament notes with a request for quote. Matching the train to the foam driver beats guessing from a generic brochure.
Frequently Asked Questions
How long does it take to clear biological foam after SRT correction?
Plan on 1–3 SRT cycles, which is typically 5–15 days for a conventional plant running a 5-day SRT and 30–45 days for an MBR running 15-day SRT. The dominant filament population does not drop instantly; it is washed out as the reactor ages biomass under the new wasting rate. Track the foam thickness and the filament index weekly to confirm the trend is downward.
Is antifoam safe to dose directly into an MBR?
Silicone antifoam is not safe as a routine MBR dose. Silicone deposits on PVDF and PES membranes and shortens cleaning intervals. Field experience shows transmembrane pressure rising 15–20% within 10 days of continuous silicone dosing (HydropureWater field data, 2025). If an antifoam is required, use polyalkylene-glycol or fatty-alcohol types at 1–5 mg/L, and treat it as a stopgap while operational or biological controls are put in place.
What influent FOG level triggers a DAF retrofit?
If influent oil and grease routinely exceeds 50 mg/L and the basin shows biological foam, an upstream dissolved air flotation (DAF) system is the highest-leverage fix. Plants that hold FOG under 30 mg/L at the headworks rarely see filament-driven foam, regardless of SRT. Designing DAF for variable food-industry loads is covered in our 2026 food and beverage pretreatment guide.
Can Nocardia and Microthrix parvicella be distinguished without a gram stain?
A phase-contrast wet mount at 100× is usually enough. Nocardia filaments are short, straight to slightly bent, and show true branching; Microthrix parvicella filaments are long, coiled like a corkscrew, and do not branch. A Gram stain confirms the call — Nocardia is Gram-positive, M. parvicella is Gram-positive but stains irregularly, and type 021N is Gram-negative. The Jenkins, Richard & Daigger manual (3rd Ed.) and Bitton (2005) both provide photomicrographs for side-by-side comparison.