Why Dairy Wastewater Is a Special Case for Biological Treatment
Dairy effluent routinely exceeds 1,000–5,000 mg/L BOD and 2,000–10,000+ mg/L COD when whey is co-discharged, putting it in the high-strength industrial category that overwhelms municipal activated-sludge design curves (per the dairy wastewater characterization review, PMC5434364, 2016). Whey alone represents 85–95% of milk volume and ~55% of milk solids, with lactose at 4–5% driving most of the organic load; roughly 50% of global whey is still discharged untreated, making whey segregation or pre-concentration the single highest-leverage intervention before any biological step (PMC5434364, 2016).
Three parameters make dairy streams atypical: wide pH swings from 4.3 (acid whey, cottage cheese) to 10.5 (CIP alkaline discharge) against a biological sweet spot of 6–9; elevated temperature of 17–25 °C year-round, with 15 °C as the conservative winter design point and ~1.5× faster biodegradation kinetics in summer per the Arrhenius relationship; and hydraulic shock from CIP cycles, with a diurnal inequality coefficient of 1.4–2.0 and a seasonal range of 1.5 (summer, 2–3 shift) to 2.6 (winter) (PMC5434364, 2016). On average, ~70% of fresh water intake leaves as wastewater, and effluent volume is ~2.5× the volume of processed milk without GMP controls — a 0.5–2 m³/t range is achievable with good housekeeping. Fat droplets are emulsified at 1–10 µm, resist mechanical separation, and require DAF pre-treatment for FOG and suspended solids removal before any biofilm reactor.
| Parameter | Typical dairy effluent range | Design implication |
|---|---|---|
| BOD₅ | 1,000–5,000 mg/L | High-rate biological step required |
| COD | 2,000–10,000+ mg/L | Consider anaerobic pre-treatment if whey > 30% of load |
| FOG | 100–1,000 mg/L | DAF mandatory; MABR feed < 50 mg/L FOG |
| TN | 50–250 mg/L (whey protein) | Robust nitrification needed; high free-ammonia risk |
| pH | 4.3–10.5 (stream); 6–9 (biology) | Equalization with pH buffering required |
| Temperature | 17–25 °C (design 15 °C winter) | No cooling; warm stream favours nitrification |
| Diurnal K | 1.4–2.6 | Equalization basin 6–12 h HRT |
How MABR Works and Why the Counter-Diffusion Design Matters for Dairy
A membrane aerated biofilm reactor (MABR) uses a gas-transfer hollow-fiber membrane as both the oxygen source and the biofilm carrier. Air at near-atmospheric pressure (5–15 kPa above the liquid) diffuses passively through the membrane wall into a biofilm on the lumen side, while the bulk liquid carries substrate — including ammonia and BOD — from the outside (per Fluence MABR technology overview, 2026). That counter-diffusion geometry inverts the usual concentration gradients: the highest oxygen and lowest substrate are on the lumen side, the lowest oxygen and highest substrate are on the liquid side. The result is a stratified biofilm with an aerobic nitrifying layer on the inside, an anoxic denitrifying layer on the outside, and the two reactions running in a single tank — simultaneous nitrification-denitrification without a separate anoxic zone and without methanol dosing (Fluence, 2026).
This geometry aligns unusually well with dairy's three pain points. First, the 17–25 °C stream raises nitrification rates naturally, but conventional activated sludge loses nitrifiers during high-FOG washout events; the biofilm's effectively infinite SRT retains slow-growing nitrifiers regardless of hydraulic shocks. Second, whey protein drives free-ammonia (FA) spikes that inhibit nitrifying bacteria in suspended growth; the protected lumen-side biofilm tolerates higher FA than CAS at the same loading. Third, because oxygen transfers passively through the membrane rather than via fine-bubble diffusers, there is no bubble plume to foul with emulsified fat, and no shear loss from rising bubbles — most of which escape before transfer in legacy aeration. Independent pilots report aeration energy savings up to 90% and total energy reduction up to 50% versus conventional aerobic treatment (Fluence, 2026).
MABR's commercial track record begins in 2016; today two product formats are relevant to dairy: containerized Aspiral units for greenfield or temporary plants (deployed from 300 m³/d villages to 80-unit highway rest-area projects in Hubei) and SUBRE submerged towers for retrofits of 2,000–100,000 m³/d (0.5–25 MGD) existing basins (Fluence, 2026). For plants considering a turnkey biological skid alongside an existing screen and DAF, a packaged integrated biological treatment system can shorten the retrofit outage window from months to weeks.
MABR Design Parameters for a Dairy Wastewater Treatment Train
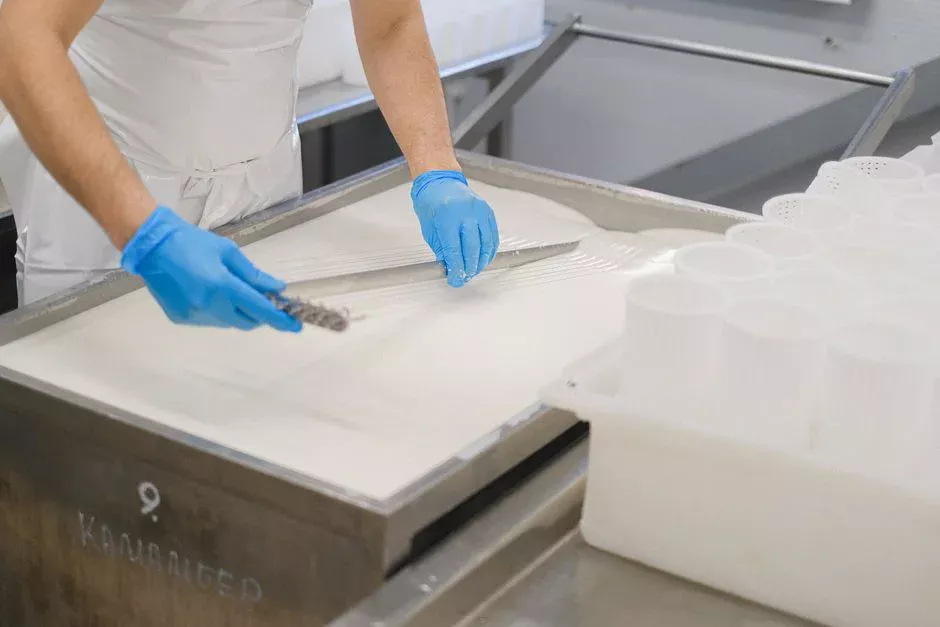
The MABR is a secondary biological step, not a primary one — it must sit behind effective FOG, suspended solids, and pH control. A defensible dairy train is: rotary bar screen → flow equalization (with pH buffering) → DAF for FOG → MABR biological reactor → optional sand or MF polish → ClO₂ or UV disinfection → reuse or discharge. The pre-treatment sequence is non-negotiable: residual FOG above ~50 mg/L coats biofilm carriers and destroys performance within weeks.
For preliminary design of the MABR stage on dairy-strength influent (post-DAF, BOD 800–3,000 mg/L, TN 50–200 mg/L, 17–25 °C), the following parameters are workable starting points (Fluence MABR performance data, 2026; engineering judgment):
| Design parameter | Recommended range for dairy | Notes |
|---|---|---|
| OLR (organic loading rate) | 1–5 kg COD/m³·d | Lower end for high-fat streams |
| HRT | 6–12 h | Buffer diurnal K = 1.4–2.6 |
| Biofilm thickness | 200–500 µm | Controlled by intermittent air-scour |
| Effective SRT | Effectively infinite (biofilm) | Nitrifier retention independent of HRT |
| Membrane type | Gas-transfer hollow fiber, 0.1–0.5 µm pore or dense-wall | PVDF or PDMS typical |
| Blower pressure | 5–15 kPa above liquid | Passive transfer, low energy |
| Temperature window | 10–35 °C | Dairy 17–25 °C well within range |
| Expected effluent COD | < 100 mg/L | Often < 50 mg/L on cheese plant streams |
| Expected effluent BOD | < 20 mg/L | Sufficient for reuse in most jurisdictions |
| Expected effluent TN | < 10 mg/L; < 3 mg/L achievable | Stanford pilot result, Fluence 2026 |
| Expected effluent TP | < 1 mg/L; < 0.3 mg/L with chemical P | Stanford pilot result, Fluence 2026 |
Equalization should hold at least 6–12 h of average flow, sized to flatten the 1.4–2.6 diurnal inequality coefficient, and should include caustic/acid dosing or CO₂ sparging to hold pH between 6.5 and 8.5 entering the MABR. The rotary bar screen ahead of the DAF protects the flotation cell from curd pieces and packaging debris, while the DAF carries the FOG load off as float sludge. Post-MABR, a ClO₂ disinfection generator sized for 1–3 mg/L residual handles reuse for CIP rinse, boiler feed, or landscape irrigation. Plants targeting surface-water discharge or stricter reuse may add a downstream MBR polish — covered in the next section.
MABR vs MBR vs Conventional Activated Sludge for Dairy Effluent
The buyer's real question is not "what is MABR" but "should I upgrade my existing activated sludge, retrofit an MBR, or install MABR?" The honest answer depends on which constraint binds first: footprint, energy, effluent nitrogen, fat tolerance, or capital cost. The table below summarizes the trade-offs as they apply to dairy-strength influent (Fluence MABR data, 2026; HydropureWater MBR field data, 2026):
| Criterion | CAS (fine-bubble) | MBR (submerged PVDF UF) | MABR (gas-transfer biofilm) |
|---|---|---|---|
| Footprint | Baseline (1.0×) | ~0.4× of CAS | ~0.5× of CAS |
| Aeration energy | Baseline | Baseline + membrane air-scour | Up to 90% lower than CAS |
| Overall energy | Baseline | Higher due to UF pump + scour | Up to 50% lower than CAS |
| Effluent TN (no methanol) | 10–20 mg/L unless anoxic zone | 5–10 mg/L with anoxic zone | < 3 mg/L (SND in single tank) |
| Effluent TP (no chem P) | 1–3 mg/L | 1–3 mg/L | < 1 mg/L; < 0.3 mg/L with coagulant |
| FOG / fat tolerance | Poor — bulking, foaming | Poor — membrane fouling | Good if DAF < 50 mg/L upstream |
| Effluent TSS | 10–30 mg/L | < 1 mg/L (UF barrier) | 5–15 mg/L |
| Hydraulic shock handling | Poor (SRT = HRT) | Moderate (mixed-liquor storage) | Strong (biofilm SRT ≫ HRT) |
| External carbon (methanol) | Often required for denitrification | Often required | Not required (SND) |
| CAPEX | Lowest (legacy) | Highest (membranes + tankage) | Moderate (retrofit-friendly SUBRE) |
| OPEX | High energy + sludge | High energy + membrane replacement | Lowest energy, minimal membrane replacement |
For a greenfield plant with strict reuse requirements, MBR's solid-liquid separation barrier remains unmatched and a downstream DF-series flat-sheet MBR module polish after a MABR biological stage is a defensible combination. For a brownfield overloaded activated-sludge basin, SUBRE-style MABR towers dropped into the existing tankage is the lowest-disruption upgrade path with the strongest nitrogen-removal gain (per Fluence SUBRE retrofit data, 2026).
Case Narrative: Retrofitting a Mid-Sized Cheese Plant with MABR
A 30,000 m³/d cheese plant in Central Europe was running three activated-sludge basins at ~40% overload, with chronic bulking, clarifier overflow, and a permit-driven TN limit tightening from 15 to 10 mg/L. Raw influent averaged 4,800 mg/L BOD, 8,200 mg/L COD, 180 mg/L TN, 400 mg/L fat, and 22 °C. CIP discharges pushed pH to 9.8 twice per day. Methanol dosing for denitrification had been running at 6 t/d with inconsistent results.
The retrofit retained the existing DAF and bar screen, added a 10,000 m³ equalization basin with pH buffering (target 6.5–8.5), and dropped SUBRE-style MABR towers into the parallel aeration basins — no new tankage, no new clarifier. Air supply was re-plumbed from the high-pressure blower loop to a low-pressure (8–12 kPa) manifold. Six months after start-up the plant reported effluent TN below 5 mg/L without methanol, effluent BOD below 15 mg/L, no chemical cleaning of biofilms in the operating window, and blower electricity down ~70% against the pre-retrofit baseline. The two highest-leverage investments were the new equalization tank and tighter DAF control — a lesson consistent with the dairy characterization literature on FOG and pH variability (PMC5434364, 2016). The bar screen on the upstream end was rebuilt in parallel because the original was under-sized for the new peak flow.
Sizing, Cost, and Decision Framework for MABR in Dairy Plants
For preliminary sizing after a DAF, plan on 0.5–1.0 m² of MABR biofilm area per m³/d of dairy-strength influent, scaling toward the lower end of the range as BOD rises above 3,000 mg/L. Use containerized Aspiral units for flows below 2,000 m³/d, mobile plants, or temporary capacity; use SUBRE towers for retrofits of 2,000–100,000 m³/d (0.5–25 MGD) basins where existing civil works should be preserved (Fluence, 2026). Plants in the 5,000–50,000 m³/d range with 24/7 aeration loads typically see simple payback on the MABR CAPEX in 3–5 years from the 50–90% aeration energy reduction alone, before accounting on avoided methanol, reduced sludge handling, and discharge compliance.
A defensible decision framework for a plant manager is: (1) if FOG is below 50 mg/L after DAF, BOD is below 5,000 mg/L, and flow is above 5,000 m³/d, MABR as a secondary biological step is the lowest-OPEX path; (2) if FOG routinely spikes above 200 mg/L despite DAF, prioritize DAF upgrade or MBR for fouling tolerance; (3) if COD exceeds 10,000 mg/L with continuous whey discharge, add an anaerobic pre-treatment (UASB or AnMBR) upstream of MABR to cut aeration load by 60–80%. No specific CAPEX figures are published in the cited sources, so ranges must be developed vendor-by-vendor. For procurement teams scoping a full train — equalization through reuse — HydropureWater's integrated biological treatment packages can be quoted alongside MABR-adjacent civil and disinfection equipment. For a complementary read on high-strength industrial design, see the SBR design guide for high-strength industrial wastewater and the 2026 ZLD adoption outlook for end-of-pipe reuse economics.
Limitations, Risks, and Open Questions for MABR in Dairy Service
MABR is not a turnkey drop-in for dairy. Residual FOG above ~50 mg/L coats biofilm carriers and degrades performance within weeks — DAF pre-treatment is non-negotiable, not optional. Biofilm thickness control depends on disciplined air-scour design; poor hydraulic distribution leads to clogging and channeling inside the membrane tower. Long-term membrane durability under continuous oxygen exposure at 17–25 °C is the primary operating risk, and replacement intervals in dairy service are not yet well documented. Most importantly, there is no large-scale, dairy-specific commercial MABR dataset published as of 2026; the best available evidence is municipal pilots (Stanford CR2C, CENTA Spain) and full-scale non-dairy retrofits, which is a real evidence gap that a dairy plant considering MABR should pressure-test with a side-stream pilot before full commitment. Finally, segregating whey for lactose or protein recovery often beats treating it biologically — a resource-recovery upstream decision can shrink the MABR by 40–60% before the first biofilm module is ordered.
Frequently Asked Questions
Is MABR suitable for high-strength dairy wastewater?
Yes, provided FOG and pH are pre-treated. After DAF and equalization, MABR pilots and commercial systems report effluent TN below 3 mg/L and TP below 0.3 mg/L on high-strength streams, with simultaneous nitrification-denitrification in a single tank (per Fluence Stanford pilot, 2026).
How much energy does MABR save versus conventional aeration?
Up to 90% on aeration and up to 50% on total plant energy versus conventional activated sludge. Passive oxygen transfer through the membrane replaces the inefficient bubble-plume of fine-bubble diffusers, where most bubbles escape before transferring oxygen (Fluence MABR technology overview, 2026).
Can MABR replace MBR in a dairy plant?
It can replace the secondary biological step, but not the membrane solid-liquid separation barrier. Many high-reuse designs combine DAF + MABR + a downstream MBR polish to get both low-TN biology and TSS below 1 mg/L for reuse.
What pre-treatment does dairy effluent need before MABR?
Bar screening, flow equalization with pH buffering (target 6.5–8.5), and DAF to bring FOG below ~50 mg/L. Without these, MABR biofilms foul and lose performance within weeks (per dairy wastewater characterization, PMC5434364, 2016).
Does MABR work in containerized form for small dairies?
Yes. Aspiral units ship in standard 20-ft or 40-ft containers and have been deployed from 300 m³/d village plants to 80-unit highway rest-area installations in Hubei, China (Fluence, 2026). They are well suited to remote dairies, seasonal creameries, and emergency or temporary capacity.
What is the typical effluent quality from MABR on dairy wastewater?
With proper pre-treatment, expect COD below 100 mg/L, BOD below 20 mg/L, TN below 10 mg/L and often below 3 mg/L, and TP below 1 mg/L (below 0.3 mg/L with chemical phosphorus removal). The effluent is suitable for non-potable reuse including CIP rinse, boiler feed, and landscape irrigation (Fluence, 2026).