Why Bakery Wastewater Fits an SBR
An SBR (sequencing batch reactor) treats bakery wastewater effectively in small plants under 100 m³/d with stable influent. Bakery effluent carries soluble BOD of 800-2,500 mg/L, TSS of 200-1,500 mg/L, FOG above 300 mg/L on poorly managed lines, and a BOD/COD ratio of 0.5-0.6, all readily biodegradable substrate. A typical bakery SBR runs 4-6 hour cycles with MLSS of 3,000-5,000 mg/L, F/M of 0.1-0.3 kg BOD/kg MLSS·d, and a 20-40 hour HRT, delivering 85-95% COD removal and >90% BOD removal at full scale.
The substrate profile is the first thing to confirm before specifying any biological stage. Bakery effluent runs warm (30-45 °C from oven condensate and CIP), swings in pH from 4 to 11 across clean-in-place cycles, and carries a BOD/COD ratio of 0.5-0.6 — a clear signal that the carbon is biodegradable rather than refractory. A study at a municipal WWTP in Lipsk, Poland (Journal of Ecological Engineering, 2016) recorded measurable COD fraction shifts when bakery sewage entered the receiving plant, confirming that the load is real and that downstream biology can metabolize it without exotic acclimation. That same work flagged the dark color and elevated TKN that come with bakery discharge, both of which an SBR can address inside a single tank.
Batch biology fits a bakery's operating rhythm for a specific reason. Most bread, biscuit, and pastry plants run two predictable production shifts with a CIP window that produces a stable, repeating flow profile. An SBR's timed cycles absorb that rhythm without the surge tolerance an MBBR or continuous-flow activated-sludge system would need to engineer in. For a plant with one operator and limited footprint, that alignment between influent pattern and reactor cycle is the deciding factor — and it is the gap that most generic biological-stage articles leave open.
The Four SBR Phases and How a Bakery Runs Them
An SBR runs four mandatory phases per cycle — fill, react, settle, decant — plus an optional idle/waste window. For bakery service at moderate loads, a total cycle of 4-6 hours is standard; for high-strength effluent above 2,500 mg/L COD after DAF, extend the cycle to 6-8 hours so the react phase can fully consume the carbon.
Fill runs 0.5-1.0 hour with mixed liquor at roughly 1.5× the design flow Q, so the incoming waste contacts active biomass immediately rather than displacing clarified supernatant. React runs 2-4 hours with dissolved oxygen held at 2-4 mg/L for BOD removal; raise DO to 3-4 mg/L if simultaneous nitrification is required (per the MBBR design benchmarks in the Hydropure 2026 guide, the same DO envelope applies to SBR suspended-growth biomass). Settle runs 0.5-1.0 hour under quiescent conditions to produce a clear supernatant; skim any scum that rises with the FOG fraction the DAF upstream did not catch. Decant runs 0.5-1.0 hour through a floating weir limited to 1.0-1.5 m³/m·h to avoid pulling solids into the effluent. Idle runs 0.5-1.0 hour and is the conventional window for waste activated sludge removal, typically 0.5-1.5% of daily flow as WAS to keep SRT inside the 10-30 day band.
Intermittent aeration is the lever for nitrogen control. Alternating aerobic and anoxic phases inside the react step drives simultaneous nitrification/denitrification in the same tank — the same approach used on bakery MBBRs, with aerobic DO at 2-4 mg/L followed by anoxic mixing at DO below 0.5 mg/L for 30-60 minutes per cycle. For a bakery with a TN limit, this is cheaper than a dedicated anoxic basin and adds no footprint.
| Phase | Bakery duration (moderate load) | Bakery duration (high-strength >2,500 mg/L COD) | Key control |
|---|---|---|---|
| Fill (mixed) | 0.5-1.0 h | 1.0-1.5 h | 1.5× Q mixed liquor contact |
| React (aerobic) | 2-4 h | 4-6 h | DO 2-4 mg/L (3-4 mg/L if nitrification) |
| Settle (quiescent) | 0.5-1.0 h | 0.75-1.0 h | No aeration, no mixing |
| Decant | 0.5-1.0 h | 0.5-1.0 h | Weir loading 1.0-1.5 m³/m·h |
| Idle / waste | 0.5-1.0 h | 0.5-1.0 h | WAS at 0.5-1.5% of daily flow |
| Total cycle | 4-6 h | 6-8 h | 4-5 cycles/d typical |
SBR Design Parameters for Bakery Effluent

Five numbers define a bakery SBR spec: MLSS, F/M, HRT, SRT, and the volume exchange ratio. MLSS of 3,000-5,000 mg/L is the operating range — the lower end (3,000 mg/L) settles faster and gives a clearer decant, the higher end (5,000 mg/L) packs more treatment capacity into a smaller footprint at the cost of higher decant turbidity and a longer settle phase. F/M of 0.1-0.3 kg BOD/kg MLSS·d is the standard band; target 0.15-0.20 for steady-state bakery service so the biomass is neither over-fed (pinpoint floc, poor settling) nor starved (long SRT, foam).
HRT of 20-40 hours total across the cycle is the design envelope. For a 50 m³/d bakery with 2,000 mg/L COD after DAF, that band works out to a 40-85 m³ reactor, which the worked example below lands inside. SRT of 10-30 days supports nitrification and produces a more stable sludge; longer SRT raises the minimum aeration time required per cycle, so do not push SRT past 30 days on a bakery unless the blower is sized for it. Decant rate is limited by weir loading — hold 1.0-1.5 m³/m·h so the hydraulic gradient does not pull settled solids into the supernatant. Volume exchange ratio of 25-50% per cycle is the standard range; higher ratios raise treatment capacity per cycle but demand tighter decant control and a longer settle phase.
On removal performance, design conservatively to 85-90% COD and >90% BOD at full scale. The closest published biofilm benchmark — the Kaldnes K1 study at 20% carrier fill (Tanjungpura University, 2019) — recorded 91% BOD and 93.81% COD on a comparable high-strength biodegradable feed; a bakery SBR running warm influent with 24-hour HRT should clear the lower end of that range with margin, and the upper end is achievable in steady-state operation.
| Parameter | Bakery SBR design range | Design target | Notes |
|---|---|---|---|
| MLSS (mg/L) | 3,000-5,000 | 4,000 | Lower = better settling; higher = more capacity |
| F/M (kg BOD/kg MLSS·d) | 0.1-0.3 | 0.15-0.20 | 0.20 typical for steady-state bakery service |
| HRT (h) | 20-40 | 24-30 | Includes fill, react, settle, decant, idle |
| SRT (d) | 10-30 | 15-20 | Longer SRT supports nitrification |
| DO setpoint (mg/L) | 2-4 | 2-3 (BOD only), 3-4 (nitrification) | Intermittent aeration for SND |
| Decant weir loading (m³/m·h) | 1.0-1.5 | 1.2 | Above 1.5 pulls solids |
| Volume exchange ratio | 25-50% | 30% | Higher = more capacity, tighter control |
| WAS (% of daily flow) | 0.5-1.5% | 1.0% | Controls SRT |
| COD removal | 85-95% | 85-90% conservative | Design to lower end; >93% demonstrated (Tanjungpura 2019) |
| BOD removal | >90% | >90% | 91% demonstrated (Tanjungpura 2019) |
SBR vs MBBR vs SAF: Which Biological Stage Fits a Bakery
Three biological stages realistically fit a bakery plant: MBBR, SBR, and submerged aerated filter (SAF). All three can meet a typical 30/100 mg/L BOD/COD envelope with proper design; the difference is footprint, operator burden, and load-tolerance — and that difference decides the winner for a small bakery with one operator and stable flow.
SBR fits flows under 100 m³/d with stable influent and a single operator who can manage batch cycles and a decant weir. The capital cost is lower than MBBR for a greenfield plant at this scale (one tank instead of an aeration basin plus carriers plus a sieve), but operator burden is higher because the cycle is timed and the decant is a controlled event, not a continuous overflow. MBBR fits variable flow, footprint-constrained sites, and retrofits into an existing aeration tank — it uses 30-40% less space than conventional activated sludge (CWT, cited in the Hydropure 2026 MBBR guide) and tolerates the load swings a multi-product plant with irregular CIP produces. SAF is compact but carries documented bioclogging and headloss issues and is harder to expand once installed.
The decision rule, framed for a bakery: pick SBR for a 20-100 m³/d two-shift plant with one operator and a repeating flow pattern. Pick MBBR for a >100 m³/d multi-product plant with shift swings, or any retrofit into an existing aeration tank (the MBBR for bakery wastewater 2026 engineering design guide covers that case in full). Pick SAF only if footprint is the dominant constraint and the team accepts more media maintenance and headloss monitoring than the other two options.
| Criterion | SBR | MBBR | SAF |
|---|---|---|---|
| Best-fit flow range | 20-100 m³/d | 50-500+ m³/d | 20-200 m³/d |
| Footprint | Moderate (single tank, taller) | Smallest (30-40% less than CAS, per CWT) | Compact (fixed-film tower) |
| Load tolerance | Moderate (batch timing assumes steady feed) | High (biofilm self-regulates via sloughing) | Low-moderate (media clogs under shock load) |
| Operator burden | Higher (timed cycles, decant control) | Low (no sludge recycle) | Moderate (backwash, headloss) |
| Sludge handling | Batch wasting, must size sludge storage | Low yield, no sludge recycle | Low yield, but sloughing uneven |
| Retrofit ease | Low (batch cycle conflicts with continuous flow) | High (carriers added to existing tank, per Wikipedia) | Low (fixed media, hard to expand) |
| Maintenance | Low equipment, more controls | Low equipment, more controls | Moderate (replacement media, backwash) |
The Canonical Bakery SBR Treatment Train
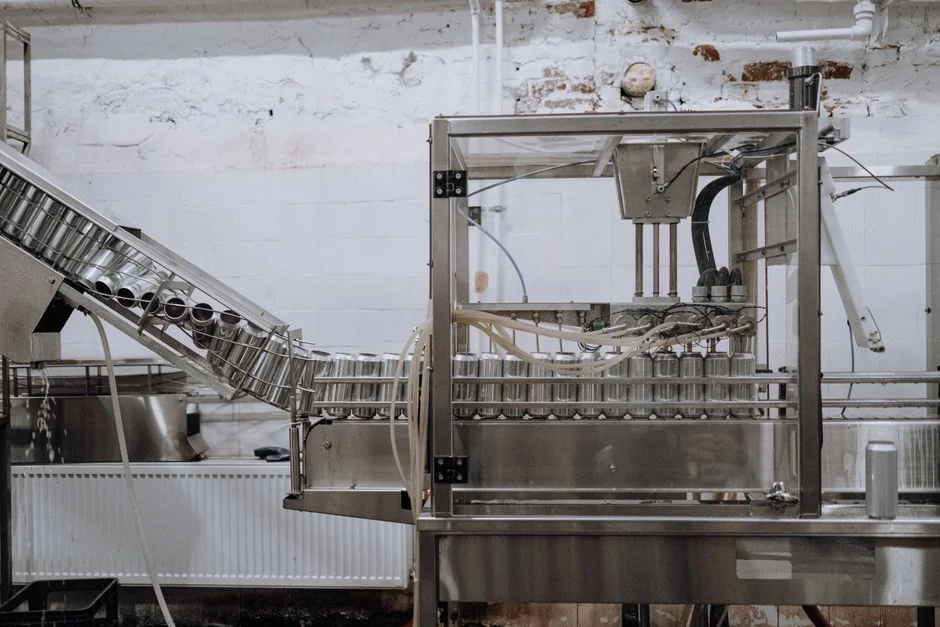
An SBR does not sit alone. The full treatment train for a small bakery is: GX series rotary mechanical bar screen → dissolved air flotation system → equalization basin → SBR reactor → secondary clarifier or MBR polish → chlorine dioxide generator → discharge or reuse. Each step has a specific job the others cannot cover.
The bar screen protects the DAF from rags, packaging carryover, and large debris that would otherwise blind the flotation cells. The dissolved air flotation system strips FOG, starch, and most TSS — FOG above 300 mg/L on a poorly managed line will coat the SBR biomass and destroy settle-phase clarity, so DAF is not optional upstream of the reactor. The equalization basin absorbs the CIP pH swings (4-11) and flow surges; spec 8-24 hours of retention depending on production variability. The SBR does the carbon and ammonia reduction in a single tank. The clarifier or MBR polish captures any solids that escape the settle phase — the MBR installation and commissioning 2026 engineering guide covers the polish option in detail when reuse is the target. The chlorine dioxide generator finishes the job for POTW discharge or on-site reuse; size the generator to the post-SBR flow, not the raw influent.
Worked SBR Sizing Example for a 50 m³/d Bakery
Inputs: 50 m³/d flow, 2,000 mg/L COD after DAF, 1,000 mg/L BOD, target F/M 0.2 kg BOD/kg MLSS·d, MLSS 4,000 mg/L, HRT target 24 hours.
Step 1 — daily BOD load: 50 m³/d × 1,000 g/m³ = 50 kg BOD/d. Step 2 — required MLSS inventory at the target F/M: 50 kg BOD/d ÷ 0.2 kg BOD/kg MLSS·d = 250 kg MLSS. Step 3 — reactor volume at 4,000 mg/L (4 kg/m³) MLSS: 250 kg ÷ 4 kg/m³ = 62.5 m³. Step 4 — HRT check: 62.5 m³ ÷ 50 m³/d = 1.25 days = 30 hours, inside the 20-40 hour design envelope. Step 5 — cycles per day at a 5-hour cycle: 24 h ÷ 5 h = ~5 cycles/d. Step 6 — volume exchange at 30% per cycle: 0.30 × 62.5 m³ = 18.75 m³ treated per cycle, or 93.75 m³/d of treatment capacity against 50 m³/d of influent — a healthy margin for the WAS removal and the standby window.
Predicted effluent: COD 100-300 mg/L (85-95% removal), BOD 50-100 mg/L (>90% removal). That envelope lands inside typical POTW discharge limits for biodegradable industrial effluent and clears most reuse thresholds for non-contact applications. The tank fits on a single pad 6 m × 4 m × 3.5 m, well inside the footprint envelope for a small bakery plant.
Frequently Asked Questions
What removal efficiency does an SBR deliver on bakery wastewater?
At full scale, an SBR delivers 85-95% COD removal and >90% BOD removal on bakery effluent after upstream DAF. Conservative design point is 85-90% COD; steady-state plants running 24-hour HRT and stable influent routinely clear the upper end of that range.
What HRT, MLSS, and F/M should a designer use for a bakery SBR?
Target HRT 20-40 hours (24-30 hours is a reasonable midpoint), MLSS 3,000-5,000 mg/L (4,000 mg/L is the standard), and F/M 0.15-0.20 kg BOD/kg MLSS·d. These numbers are anchored against the Kaldnes K1 biofilm benchmark (Tanjungpura University, 2019) and field experience on warm, high-strength biodegradable food-industry effluent.
When is SBR preferred over MBBR for a bakery?
Pick SBR for flows under 100 m³/d, two-shift production, stable influent, and a single operator who can manage batch cycles and a decant weir. Pick MBBR for flows above 100 m³/d, variable load, or any retrofit into an existing aeration tank — the MBBR for bakery wastewater 2026 engineering design guide covers that case.
Is DAF required upstream of a bakery SBR?
Yes. FOG above 300 mg/L will coat the SBR biomass, foul aeration, and destroy settle-phase clarity. A well-sized DAF dropping FOG below 30 mg/L and TSS below 150 mg/L is the difference between a stable biological stage and chronic oxygen-transfer failure. The DAF or clarifier for food and beverage wastewater buyer's guide covers the upstream decision in more depth.
How long does SBR startup take on bakery effluent?
Biomass acclimation typically takes 2-4 weeks. Warm bakery influent at 30-45 °C shortens the window because mesophilic heterotrophic kinetics roughly double per 10 °C inside that band; cold influent below 15 °C can extend startup to 4-6 weeks. Plan for reduced removal efficiency during the first 30 days and avoid sending the effluent to reuse during that window.