
What an AOP Design Parameter Actually Controls
AOP design parameters in 2026 are set by seven levers: pH (2.5–4 Fenton; 7–9 O3/UV), oxidant-to-COD (0.5–2.5 g H2O2/g COD or 0.5–1.5 g O3/g COD), UV fluence (30–40 mJ/cm² baseline), Fe:H2O2 (1:5–1:10), HRT (30–120 min), temperature (20–35 °C), and scavenger ceilings (alkalinity < 100 mg/L as CaCO3; turbidity < 5 NTU). Contaminant type then selects Fenton, ozone, UV/H2O2, or SR-AOP.
Matching those levers to COD, ammonia, or trace organics decides the process family. For an engineer, every AOP datasheet collapses into three parameter families. Influent water quality — COD, TOC, BOD5/COD ratio, alkalinity, bromide, turbidity, ammonia — describes what the oxidant must fight through. Operational setpoints — pH, ORP, oxidant dose, Fe:H2O2, UV fluence, HRT, temperature — describe what the skidded reactor does. Performance outputs — ·OH exposure (CT), log removal, residual oxidant, bromate — are what you prove to the regulator and to operations.
Genesis Water frames the hierarchy bluntly: chemistry is king. AOP performance is governed by how much ·OH reaches the target molecule, not by reactor geometry alone (Genesis Water Technologies, 2025). Compounds with ·OH second-order rate constants k·OH above 109 M−1s−1 respond to conventional AOP. Slower species — ammonia, certain PFAS, saturated aliphatics — need SR-AOP or extended HRT. Treat the seven-parameter table that follows as the contract between influent quality, P&ID setpoints, and the discharge permit.
The Seven AOP Design Parameters — Master Reference Table
The master table consolidates seven design levers for Fenton, ozone-based AOP, UV/H2O2, and SR-AOP. Ranges reflect typical 2026 industrial practice. They also reflect the Fenton performance ceiling of 96% COD reduction reported for the optimized Fenton reaction (waterandwastewater.com, 2025). pH and O3 dose prioritization follows Current Pollution Reports (2015).
| Parameter | Fenton | Ozone-based AOP (O3, O3/H2O2, O3/UV) | UV/H2O2 | SR-AOP (persulfate, PMS, Fe2+ or UV activation) |
|---|---|---|---|---|
| pH window | 2.5–4.0 | 7–9 | 7–9 | 3–9 (activation-dependent) |
| ORP setpoint (mV, Ag/AgCl) | +400 to +600 | +700 to +900 | +600 to +800 | +500 to +800 |
| Oxidant:COD ratio | 0.5–2.5 g H2O2/g COD | 0.5–1.5 g O3/g COD (AOP), 2–3 g O3/g COD (O3 only) | 0.3–1.0 g H2O2/g COD | 1–5 mM persulfate, stoichiometry set by target |
| Fe:H2O2 (w/w) | 1:5 to 1:10 | N/A | N/A (optional Fe2+ for photo-Fenton) | Fe2+:PS 1:1 to 1:2 (molar) |
| UV fluence (mJ/cm²) | N/A | 15–30 (O3/UV only) | 30–40 baseline micropollutant; 400–600 for 90% TOC on recalcitrant streams | 20–60 (UV activation only) |
| HRT (min) | 60–120 | 10–30 (contactor) + 10–20 (AOP) | 5–15 | 30–90 |
| Temperature (°C) | 20–35 | 20–35 (cooling above 40 °C) | 20–30 | 20–40 |
| Alkalinity ceiling (mg/L as CaCO3) | < 100 | < 100 | < 100 | < 200 |
| Turbidity ceiling (NTU) | < 5 (after coagulation) | < 5 | < 5 (UV-transmittance > 80%/cm) | < 10 |
| Bromide ceiling (µg/L) | N/A | < 50 (bromate control) | Not ozone-limited | Not ozone-limited |
Two footnotes anchor these ranges. First, Fenton at pH 3 and Fe:H2O2 ≈ 1:8 has been reported at up to 96% COD reduction for compatible wastewaters (waterandwastewater.com, 2025). That 96% is the ceiling, not the routine target. Second, adjust operating parameters in this order: pH first, then oxidant dose, then contact time (Current Pollution Reports, 2015). Put that order on your cause-and-effect matrix. For a turnkey skid, specify a PLC-controlled chemical dosing skid for H2O2, Fe2+ and persulfate feed that holds the ratios above within ±5% across the turndown range.
pH, ORP and Temperature — The Process Envelope
pH, ORP, and temperature must lock first, or the rest of the parameter table drifts. Fenton requires pH 2.5–4 because iron precipitates as Fe(OH)3 above pH 4. Precipitation kills catalyst recycle and blinds downstream DAF or lamella units (Genesis Water Technologies, 2025). Ozone- and UV-based AOP prefer pH 7–9. In that window the ·OH fraction of total oxidant flux is maximized and O3 decomposition to ·OH is fastest. At pH < 6 ozone persists as molecular O3 and selectivity for refractory organics drops (Current Pollution Reports, 2015).
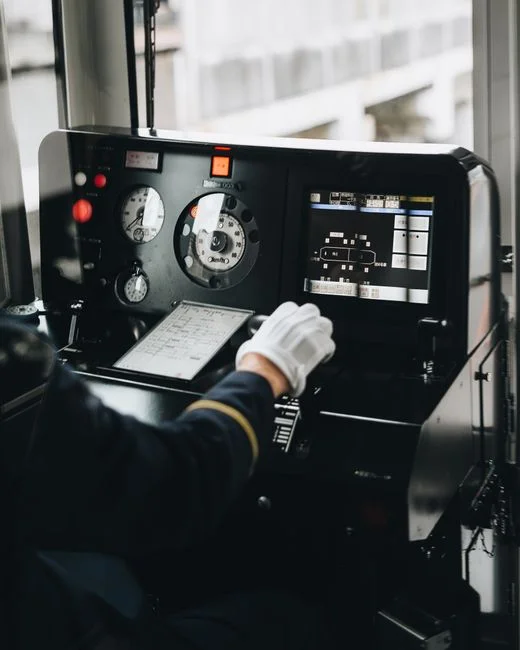
ORP setpoints translate chemistry into a 4–20 mA signal. An active ·OH-generating Fenton reactor sits at +400 to +600 mV (Ag/AgCl). Ozone and UV/H2O2 run hotter at +700 to +900 mV. Below +400 mV the reaction is oxidant-limited and log removal collapses. Above +900 mV carbonate scavenging and ·OH quenching accelerate. You then burn oxidant without proportional log reduction (Genesis Water Technologies, 2025). The ORP loop is the cheapest real-time check of whether the skid is doing useful work.
Temperature has two opposing effects. Higher temperature raises the ·OH reaction rate roughly 2–3× per 10 °C on most organics. It also cuts ozone solubility by ~50% between 20 °C and 40 °C. The practical window is 20–35 °C for ozone AOP. Above 40 °C install a heat exchanger on the AOP feed. Below 10 °C oversize the ozone contactor or switch to UV/H2O2 (Genesis Water Technologies, 2025). Most plants we size for pharmaceutical mother liquors and dye bath spent liquor run at the lower end of that 20–35 °C band to keep ozone solubility up.
Oxidant Stoichiometry — H2O2, O3, Persulfate and UV Dose
Oxidant stoichiometry is the line item procurement reads first, so it has to be defensible. Full Fenton mineralization bottoms out at 2.125 g H2O2 per g COD to CO2 and H2O. The practical dose with biological polishing is 0.5–2.5 g H2O2/g COD. Iron dose is one-fifth to one-tenth of the H2O2 mass (waterandwastewater.com, 2025). Use the high end only on recalcitrant streams biology cannot finish. On a readily biodegradable influent, 0.5 g H2O2/g COD plus biology typically hits discharge COD at lower chemical OPEX.
Ozone stoichiometry splits by mode. O3/H2O2 or O3/UV (peroxone and O3/UV) runs 0.5–1.5 g O3/g COD. H2O2 or UV shifts the mechanism from selective molecular O3 to ·OH-driven oxidation. O3 alone climbs to 2–3 g O3/g COD on refractory streams. Without a ·OH booster, most of the dose is consumed by direct oxidation of bulk COD (Current Pollution Reports, 2015). A 1 kg O3/h generator at a typical 10 kWh/kg O3 power draw then becomes the largest electrical load line.
UV fluence is the design lever unique to photolytic AOP. The 30–40 mJ/cm² baseline is enough for UV/H2O2 on trace organics and micropollutants. For 90% TOC reduction on industrial recalcitrant streams — pharmaceutical mother liquors, dye bath spent liquor, landfill leachate — design for 400–600 mJ/cm². Verify with bench-scale collimated-beam testing on the actual wastewater. A one-liter bench test will save a five-figure mistake on lamp count (Current Pollution Reports, 2015).
SR-AOP using persulfate (S2O82−) or peroxymonosulfate at 1–5 mM, activated by Fe2+, heat, base or UV, is the only hydroxyl-/sulfate-radical family that oxidizes refractory organics and ammonia together. That dual capability fits landfill leachate and ammonia-laden industrial condensates. Conventional ·OH AOPs run out of capacity on the ammonia fraction (Current Pollution Reports, 2015). Dose persulfate on a nitrogen-plus-COD mass balance, not on COD alone, or ammonia stays under-oxidized.
Scavenger Control — Alkalinity, NOM, Bromide, Nitrate
Scavenger control is almost always cheaper than overdosing oxidant. The numeric ceilings are non-negotiable. Bicarbonate and carbonate alkalinity above 100 mg/L as CaCO3 is the dominant ·OH sink. One alkalinity molecule consumes one ·OH to form carbonate radical, which is two orders of magnitude less reactive than ·OH (Genesis Water Technologies, 2025). Fenton cares less because pH 2.5–4 already shifts the carbonate equilibrium. For ozone and UV/H2O2 at pH 7–9, alkalinity above 100 mg/L as CaCO3 forces acid dosing (H2SO4) or CO2 stripping before the contactor.
| Scavenger | Ceiling for ·OH AOP | Control measure | Cost-effective at |
|---|---|---|---|
| Alkalinity (HCO3−/CO32−) | < 100 mg/L as CaCO3 | Acid dosing or CO2 stripping | > 200 mg/L influent |
| TOC / NOM | < 10 mg/L for UV/H2O2 micropollutant work | Biological polishing upstream | > 20 mg/L TOC |
| Bromide (Br−) | < 50 µg/L for ozone AOP | Switch to UV/H2O2 or add NH4Cl to suppress bromate | > 50 µg/L with discharge limit ≤ 10 µg/L BrO3− |
| Nitrate (NO3−-N) | < 20 mg/L for UV AOP | Pre-denitrification or anion exchange | > 20 mg/L on UV AOP trains |
| Turbidity | < 5 NTU for UV AOP | Coagulation, sedimentation, DAF pre-treatment to hold turbidity below the UV AOP ceiling | > 10 NTU |
Natural organic matter (NOM) competes for ·OH and screens UV. TOC above 10 mg/L is the practical ceiling for UV/H2O2 on trace organics. Push biology harder upstream instead of forcing AOP to eat bulk TOC. A 70–80% TOC cut on the biological stage drops AOP oxidant demand by roughly half (Genesis Water Technologies, 2025). Where the plant already runs an AAO biological stage sizing after an AOP pretreatment, size AOP for partial oxidation only. Let the anoxic/oxic trains finish the biodegradable fraction.
Bromide above 50 µg/L on an ozone AOP will form bromate. Bromate is a known carcinogen regulated at 10 µg/L in drinking water. The cheapest control is to switch to UV/H2O2. If ozone is fixed, add ammonia (NH4Cl) to the contactor to suppress HOBr/OBr− recombination to bromate. Nitrate above 20 mg/L-N absorbs UV at 254 nm and is photoreduced to nitrite, a ·OH scavenger. For UV-based AOP, denitrify upstream or move UV AOP off the nitrate-laden stream (Genesis Water Technologies, 2025).
Reactor Sizing — HRT, UV Intensity and Power Density
Reactor sizing starts with HRT, then UV intensity for photolytic AOP, then ozone generator capacity. Fenton uses a CSTR at 60–120 min HRT. Ozone AOP uses a baffled counter-current contactor at 10–30 min plus an optional 10–20 min AOP tank. UV/H2O2 uses a plug-flow reactor at 5–15 min. SR-AOP uses a CSTR or plug-flow at 30–90 min depending on activation mode (waterandwastewater.com, 2025).
UV reactor sizing rule of thumb: lamp power (kW) ≈ Q (m³/h) × fluence (mJ/cm²) / 3600 × 0.25. That assumes 25% photonic efficiency at 254 nm and a water factor of 1.0. For a 50 m³/h skid at 40 mJ/cm², theoretical lamp power ≈ 50 × 40 / 3600 × 0.25 ≈ 0.14 kW. Multiply by 4–6× for ballast, sleeve fouling and end-of-lamp-life derating. You land at ~0.7 kW of lamp power for a single-lamp skid. At 600 mJ/cm² on a recalcitrant stream, that number climbs by 15×. This is why UV-based TOC reduction is electricity-hungry and why full-scale TOC reduction usually pairs with biological polishing.
Ozone generator sizing: budget 1 kg O3/h per 10–20 g O3/g COD removed, at ~10 kWh/kg O3. A 5 kg O3/h skid at 50 kW generator load typically removes 50–100 kg COD/h. That equipment choice drives OPEX more than any other AOP parameter. Plan LOX storage or on-site VPSA when demand stays above 3 kg O3/h. If the biological side is an oxidation ditch rather than an MBR, align HRT and sludge age with the oxidation ditch design parameters for the biological side of an AOP train. That keeps AOP intermediates from overloading the ditch aeration budget.
Control Loops, Sensors and OPEX per Log Removal

Control loops follow the parameter table directly. pH is the master loop — PID on acid/base dosing locked to the master table. ORP is the secondary loop — PID trim on H2O2 or O3 feed to hold +600 to +800 mV (Ag/AgCl). Residual H2O2 is the trim loop on Fenton and UV/H2O2 at 5–20 mg/L. Dissolved ozone is the trim loop on ozone AOP at 0.1–0.5 mg/L. UV intensity feedback from a photodiode or radiometer trims lamp power to hold design fluence despite sleeve fouling (waterandwastewater.com, 2025).
Typical 2026 energy intensity sits in these bands: UV/H2O2 ≈ 0.5–2 kWh/m3, ozone AOP ≈ 1–4 kWh/m3, Fenton ≈ 0.3–1 kWh/m3 plus chemical OPEX. Fenton OPEX is dominated by H2O2 and FeSO4·7H2O. Ozone AOP OPEX is dominated by generator electricity and feed gas. SR-AOP OPEX is dominated by persulfate cost. Model OPEX as chemicals first, electricity second, and lamp replacement third.
AOP upstream of biology — MBR or conventional activated sludge — cuts total oxidant dose by half in most published trains. It also reduces excess sludge, because AOP converts recalcitrant COD to biodegradable intermediates the biomass consumes (ScienceDirect, 2023). A MBR biological stage downstream of the AOP reactor protects membranes from particulates. It also lets operators hold a higher oxidant dose without residual carryover to the biomass. When residual oxidant reaches a membrane train, apply the field checks in membrane protection when AOP effluent carries residual oxidant. Size a PLC-controlled chemical dosing skid for H2O2, Fe2+ and persulfate feed to the parameter table so residual stays inside the trim band.
Selection Checklist and Next Step
Use this checklist before you freeze skid volume or issue an RFQ:
- Confirm target contaminant kinetics (·OH-fast COD vs ammonia / PFAS needing SR-AOP or long HRT).
- Lock pH window first (Fenton 2.5–4.0; ozone / UV/H2O2 7–9), then oxidant dose, then contact time.
- Measure scavengers: alkalinity, TOC/NOM, bromide, nitrate, turbidity against the ceilings in the master table.
- Decide AOP-before-biology vs biology-before-AOP; most plants we size for cut oxidant demand ~50% with upstream biological TOC cut.
- Budget OPEX as chemicals first, electricity second, lamp replacement third; verify UV fluence on a collimated-beam bench test when TOC reduction > 90% is required.
- Specify ORP and residual-oxidant loops so operators can see oxidant-limited versus scavenger-limited duty.
- Document bromide / bromate risk if ozone is selected, and name the control measure on the P&ID.
Who this is for: process engineers and EPC teams sizing Fenton, ozone, UV/H2O2 or SR-AOP skids for industrial COD, micropollutant or leachate duty. Who should look elsewhere: plants whose discharge limit is met by biology alone, or utilities that need only UV disinfection without ·OH generation. Next step: send influent COD, TOC, alkalinity, bromide, ammonia and the permit limit with a request for quote on an AOP skid sized to these parameters. Stoichiometry and HRT can then be checked against jar-test data.
Frequently Asked Questions
What pH window should I lock in first when sizing an AOP skid?
Lock pH before oxidant dose. Fenton requires pH 2.5–4.0 to keep iron soluble and catalytically active. Ozone and UV/H2O2 require pH 7–9 to maximize ·OH yield. Specifying pH first prevents iron precipitation loss on Fenton and alkalinity-driven ·OH scavenging on ozone/UV trains. Most plants we size for set the pH loop as the master PID and leave oxidant as the trim.
How do I calculate the H2O2 dose for a Fenton reactor from influent COD?
Use 2.125 g H2O2/g COD as the full-mineralization ceiling. Use 0.5–2.5 g H2O2/g COD as the practical range when Fenton is followed by biological polishing. Fe dose is one-fifth to one-tenth of the H2O2 mass. Verify both with a bench-scale jar test on the actual wastewater before committing skid volume. Run the high end only when biology cannot finish the residual COD.
What is the single most important scavenger ceiling for ozone AOP?
Bromide below 50 µg/L. Above this threshold, ozone AOP forms bromate, regulated at 10 µg/L in drinking water and increasingly in industrial reuse. If influent Br− exceeds 50 µg/L, switch to UV/H2O2 or add NH4Cl to the ozone contactor to suppress bromate. Alkalinity below 100 mg/L as CaCO3 remains the next ceiling to hold on the same train.
Which AOP handles ammonia at the same time as refractory COD?
SR-AOP using persulfate or peroxymonosulfate at 1–5 mM with Fe2+, heat or UV activation is the only hydroxyl-/sulfate-radical family that oxidizes ammonia and refractory organics together. Standard Fenton, O3 and UV/H2O2 leave ammonia largely untouched. Size SR-AOP on a COD + nitrogen mass balance rather than COD alone. Landfill leachate and ammonia condensates are the usual applications.
What HRT should I use for Fenton versus UV/H2O2?
Fenton CSTR reactors typically need 60–120 min HRT at 20–35 °C. UV/H2O2 plug-flow reactors run 5–15 min at the design fluence. Ozone AOP sits between them with 10–30 min contactor time plus 10–20 min optional reaction tank. Confirm HRT after jar or collimated-beam tests. Scavenger load can push you to the high end of each band.
Related Equipment
- ozone generator and tank disinfection equipment — Sizing parameters pair with ozone dose rates per tank volume.