What AOP System Troubleshooting Actually Means in 2026
AOP system troubleshooting is a symptom-first diagnostic process for advanced oxidation processes — ozonation, Fenton, UV/H₂O₂, and photocatalysis — that fail when hydroxyl radical (·OH) generation drops below design rates. The four most common root causes across all variants are incorrect pH, oxidant under-dosing, UV lamp aging, and catalyst or scavenger interference. Match the symptom to a parameter table, verify with ORP and H₂O₂ residual tests, then correct dosage, pH, or lamp output before restart.
Advanced oxidation processes are aqueous-phase oxidation methods built on generating ·OH radicals to destroy recalcitrant organics that biological treatment alone cannot break down (per the 2023 ScienceDirect review on AOP-biological combinations, S2). This guide covers the four variants that dominate industrial pharmaceutical, textile, leather, and plastics applications: ozonation, Fenton and photo-Fenton, UV/H₂O₂, and heterogeneous photocatalysis. Every AOP — regardless of variant — follows the same diagnostic logic: confirm influent characteristics, verify the oxidant dose at the injection point, check pH and ORP, inspect the energy source (UV lamp or ozone cell), and review the catalyst or peroxide feed before any restart attempt.
One pattern operators routinely miss: AOPs are typically coupled downstream of biological treatment, so a "failed AOP" is often a bio-stage upset that has changed the AOP influent. A sudden shift in influent COD, color, or alkalinity can collapse ·OH yield before the AOP hardware itself has failed. Before disassembling the skid, pull the last 72 hours of bio-stage effluent data.
Symptom-to-Cause Diagnostic Matrix: Start Here
The table below maps the most common AOP symptoms to their probable root cause, the first measurement an operator should take, and the corrective action that follows. Use it as the first stop whenever a fault alarm sounds or effluent quality drifts.
| Symptom | Probable Cause | First Diagnostic Check | Likely AOP Variant | Corrective Action |
|---|---|---|---|---|
| Effluent COD rising >20% | Bio-stage upset changed AOP influent composition | Compare last 72 h bio-effluent COD vs AOP feed | All variants | Stabilize bio-stage; re-baseline AOP dose |
| No ORP shift across reactor | ·OH generation has stopped; oxidant missing or scavenged | Read ORP probe before and after oxidant injection (target >+650 mV for ozone/H₂O₂) | Ozonation, UV/H₂O₂, Fenton | Verify oxidant feed pump stroke and chemical strength |
| Ozone cell alarm / no indicator light | Cell electronics, power supply, or backflow damage | Inspect power supply LED, check for water in cell housing | Ozonation | Replace cell or dry electronics; verify air-dryer |
| UV intensity <15 mW/cm² at sensor | Lamp aging or quartz sleeve fouling | Read inline UV sensor; pull and inspect sleeve | UV/H₂O₂, photo-Fenton | Clean sleeve with dilute acid CIP or replace lamp |
| Fenton sludge turning dark brown / yellow-brown | pH drifted above 4; Fe precipitated as Fe(OH)₃ | Measure reactor pH with calibrated probe | Fenton, photo-Fenton | Dump batch, re-acidify to pH 2.5–3.5, restart |
| H₂O₂ residual >50 mg/L in effluent | Over-dosing or poor reaction kinetics | Dip-test effluent with starch-KI strips or amperometric probe | UV/H₂O₂, Fenton, photocatalysis | Reduce H₂O₂ feed; verify catalyst or UV output |
| pH drifting in reactor | Acid/alkali feed failure or buffer depletion | Read pH probe against buffer; check dosing pump output | All variants | Calibrate probe on automatic chemical dosing skid; verify reagent strength |
| Off-gas ozone >0.1 ppm at stack | Mass-transfer failure or over-dosing (OSHA PEL = 0.1 ppm) | Sample off-gas with detector tube at destructor outlet | Ozonation | Reduce ozone output; check diffuser fouling |
Ozonation AOP Faults: Cell, Contactor, and Off-Gas
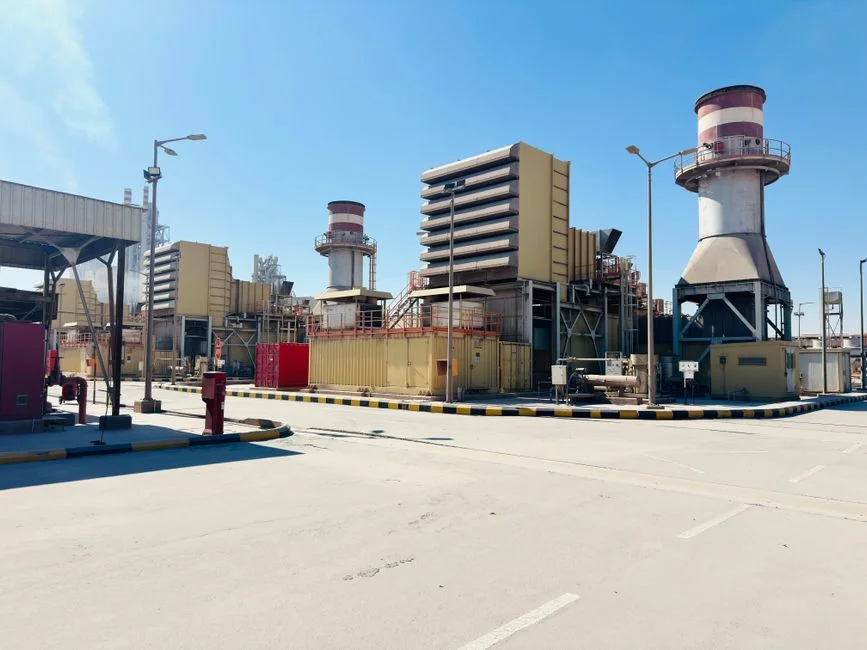
Ozone generators fail in three reproducible patterns that the operator can localize in under 10 minutes (per the CMP field troubleshooting video, S4). First, an indicator-light fault typically points to the power supply or cell electronics rather than the reactor — swap the cell to confirm. Second, water damage and backflow into the cell housing indicates a failed check valve or saturated air dryer; both are replaceable items. Third, overheating damage shows as discolored cell plates and is usually traced to blocked cooling airflow or ambient temperatures above 35 °C in the skid room.
Industrial ozonation has failure modes the pool-scale video does not cover. The most common is contactor back-mixing, which destroys the CT (concentration × time) profile the reactor was designed for and reduces ·OH yield without any cell-side alarm. Off-gas ozone above 0.1 ppm — the OSHA permissible exposure limit — is the field signal that dosing or mass transfer has failed even if the cell itself is healthy. Typical industrial ozone doses run 5–50 mg/L per stage; if off-gas is climbing while dose is steady, the diffuser or injection line is fouled, not the cell. Operators comparing disinfection strategies may also want the broader ozone vs UV buyer's guide.
Prevention cadence: inspect the dielectric monthly for micro-arc pitting, replace check valves annually, and keep inlet air at –60 °C dew point or drier. A field reference for industrial ozone generator specifications lists the OEM service intervals that should be matched to these checks.
Fenton and Photo-Fenton Troubleshooting
Fenton systems fail more often from pH and Fe:H₂O₂ ratio errors than from the chemistry itself. The non-negotiable operating window is pH 2.5–3.5: above approximately pH 4, the iron catalyst precipitates as Fe(OH)₃, the brown sludge becomes visible in the reactor, and ·OH production collapses within minutes. The visual signal is reliable — clear yellow solution means the reaction is alive; brown precipitate means the reaction is dead.
The H₂O₂:Fe molar ratio should sit between 5:1 and 10:1, and the H₂O₂:COD mass ratio should be 1:1 to 2:1 for industrial recalcitrant wastewater. Outside this band, scavenging reactions consume oxidant without producing useful radicals — excess Fe²⁺ converts to Fe³⁺ too quickly, and excess H₂O₂ recombines with ·OH to form water and oxygen. Recovery steps when the reaction has stalled: dump the batch, re-acidify with sulfuric acid to pH 2.8, titrate any residual H₂O₂ with potassium permanganate before re-dosing, and confirm the iron source (typically FeSO₄·7H₂O) matches the design P&ID.
The photo-Fenton upgrade adds UV or visible light below 580 nm, which photolytically regenerates Fe²⁺ from Fe³⁺ and can cut total iron consumption by 50–80% versus dark Fenton at equivalent COD removal. The trade-off is a quartz sleeve maintenance burden identical to a UV/H₂O₂ skid — covered in the next section and detailed in the ultrafiltration troubleshooting guide for downstream solids handling. Photo-Fenton also relaxes the pH constraint slightly, tolerating up to pH 4.5 in some industrial matrices.
UV/Hydrogen Peroxide AOP: Lamp, Dose, and Water Quality
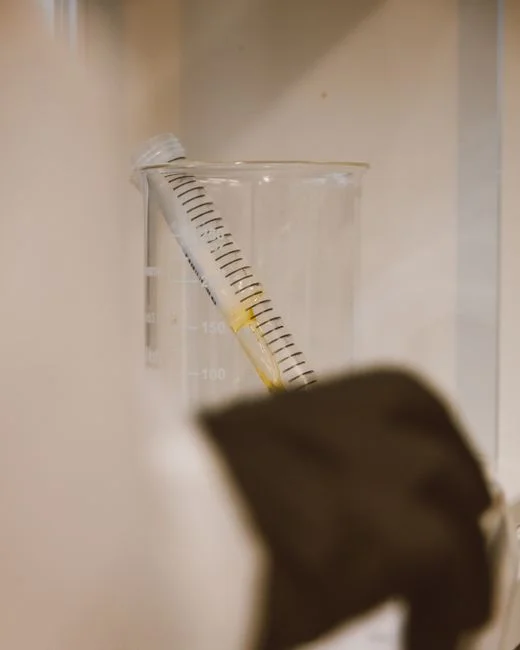
UV/H₂O₂ faults split cleanly into two categories that operators routinely confuse: optical-side failures (lamps, sleeves, sensors) and water-quality failures (UV-absorbing compounds, turbidity, alkalinity). Diagnose in that order — the optical side is faster to check and cheaper to fix.
Low-pressure mercury lamps lose 20–40% of their UV output over 8,000–12,000 hours; mid-pressure lamps age faster still. The diagnostic is a calibrated UV sensor reading at the reactor window, not lamp age alone — a 6,000-hour lamp with a fouled sleeve can underperform a 10,000-hour lamp with a clean one. Quartz sleeve fouling shows up as visible scale, iron deposits, or biofilm; transmitted UV drops 30% or more across a coated sleeve, and the standard recovery is a CIP cycle with dilute citric or nitric acid.
Water-quality interference is the harder fault. Alkalinity above 500 mg/L as CaCO₃ scavenges ·OH through carbonate radical formation. High inlet COD or color absorbs UV photons before they reach the H₂O₂ molecules, suppressing ·OH generation. Turbidity above 10 NTU blocks photons physically — pre-filtration through a multi-media pre-filter is the standard mitigation, targeting inlet turbidity below 5 NTU where possible. Prevention: log UV intensity weekly, clean sleeves monthly, and verify H₂O₂ feed with an inline conductivity or amperometric sensor rather than trusting the pump stroke alone.
Operating Parameters Reference Table
The table below consolidates the operating bands for all four AOP variants. Print it and tape it to the skid door — these are typical industrial ranges, not vendor-specific design points, so always defer to the reactor OEM's P&ID for as-built numbers.
| Parameter | Ozonation | Fenton | UV/H₂O₂ | Photocatalysis | Acceptable Range / Notes |
|---|---|---|---|---|---|
| pH | 7–9 | 2.5–3.5 | 6–8 | 5–7 | Probe: inline pH sensor; Fenton must be acidic |
| ORP (mV) | >+650 | +300 to +500 | >+400 | >+350 | Probe: ORP probe; sudden drop = oxidant feed failure |
| Oxidant dose (mg/L) | 5–50 per stage | H₂O₂ 500–2000 | H₂O₂ 50–500 | H₂O₂ 20–200 | Scale to inlet COD; over-dose wastes reagent |
| H₂O₂:COD mass ratio | N/A | 1:1 to 2:1 | 0.5:1 to 1:1 | 0.2:1 to 0.5:1 | Below ratio = under-treated; above = scavenging |
| UV intensity (mW/cm²) | N/A | 10–30 (photo-Fenton) | 15–40 | 5–20 | Probe: calibrated UV sensor at reactor window |
| Reaction time (min) | 15–60 | 30–120 | 10–60 | 30–180 | Match to CT design; lower for batch, higher for continuous |
| Fe dose (mg/L) | N/A | 50–200 as Fe²⁺ | N/A | Optional co-catalyst | FeSO₄·7H₂O standard; photo-Fenton allows 50–80% reduction |
| Catalyst loading (g/L) | N/A | N/A | N/A | 0.5–5 (TiO₂) | Settle/decant or immobilize on support |
Prevention: What to Check Weekly, Monthly, and Annually
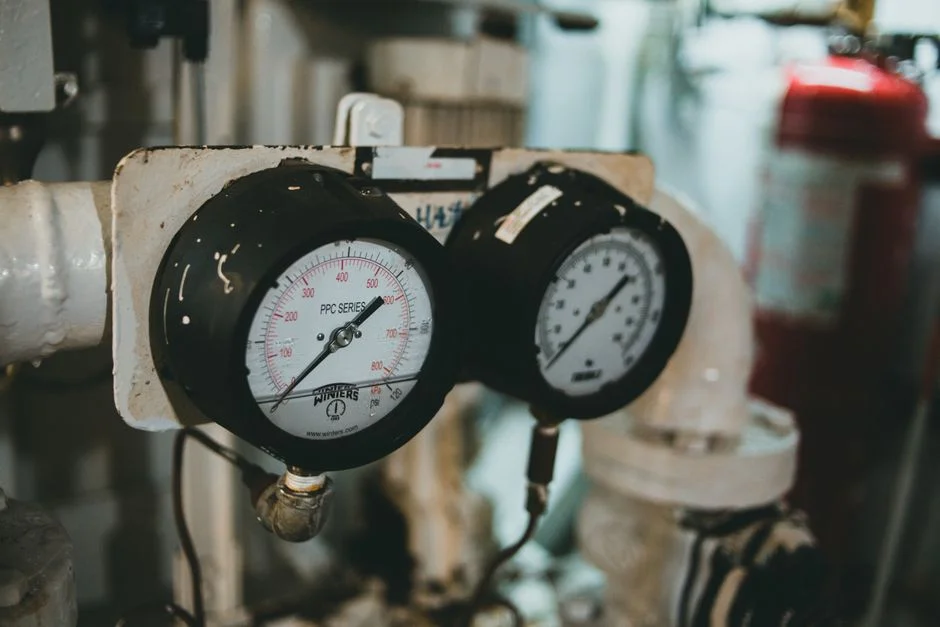
AOPs have no slack parameter — small drifts (pH ±0.3, UV output –15%, oxidant dose –10%) collapse ·OH yield non-linearly, which is why a maintenance rhythm matters more than a heroic troubleshooting session. Weekly checks: ORP and pH calibration verification against buffer standards, H₂O₂ residual dip test on the effluent, UV intensity log from the inline sensor, and ozone off-gas measurement at the destructor outlet.
Monthly checks: pull and inspect at least one quartz sleeve per reactor, test check valves on the ozone skid for backflow, audit the Fe:H₂O₂ ratio on Fenton batches against the design value, and run a catalyst settling test on the photocatalysis loop. Annual checks: replace UV lamps at 80% of rated life regardless of measured output, replace ozone cell dielectrics on schedule, and recalibrate every sensor (pH, ORP, UV, ozone) against a lab reference standard. Operators who follow this cadence typically cut AOP-related alarm hours by more than half within two quarters (HydropureWater field data, 2026).
Frequently Asked Questions
What is the most common cause of AOP underperformance?
The most common cause is oxidant under-dosing combined with a pH drift outside the design window — together they account for the majority of AOP underperformance events. Confirm both with an ORP probe reading (target >+650 mV for ozone and H₂O₂ systems) and a calibrated pH probe before assuming hardware failure.
How do you know if a UV lamp in a UV/H₂O₂ AOP needs replacing?
Read the inline UV sensor at the reactor window: if intensity has dropped below 15 mW/cm² or more than 30% below the commissioning baseline, the lamp needs replacement. Low-pressure lamps typically need replacement at 8,000–12,000 hours; mid-pressure lamps sooner. Do not judge by lamp age alone — a fouled quartz sleeve can cut output as much as a fully aged lamp.
Why does Fenton sludge turn brown and how do I recover the reaction?
Brown sludge indicates the reactor pH has risen above approximately 4, causing the iron catalyst to precipitate as Fe(OH)₃. Recovery requires dumping the batch, re-acidifying to pH 2.5–3.5 with sulfuric acid, titrating any residual H₂O₂, and restarting the Fe and peroxide feeds to the design ratio (H₂O₂:Fe molar ratio 5:1 to 10:1).
What ozone off-gas level indicates a contactor problem rather than a cell problem?
Off-gas ozone above 0.1 ppm at the destructor outlet — the OSHA permissible exposure limit — while the cell is operating normally indicates a mass-transfer or dosing fault, not a cell fault. Check diffuser fouling, contactor back-mixing, and feed-water ozone demand before suspecting the generator itself.