Electrodialysis System Troubleshooting: The 4-Fault Triage
Electrodialysis system troubleshooting follows a symptom-first playbook: identify the fault family (fouling, scaling, voltage drop, or hydraulic imbalance), confirm with a current/voltage and conductivity check, then apply a targeted fix — most commonly polarity reversal on an EDR stack, pulsed-power operation, or a CIP cycle. Industrial ED stacks use 200–400 alternate ion-exchange membranes and are most economical below 3,000 ppm feed TDS, so recovery loss is both a process and an OPEX problem.
An ED stack is a filter-press assembly of 200–400 alternating cation and anion exchange membranes between two electrodes, with feed, diluate, and concentrate streams distributed by spacers and gaskets (YASA ET, 2022-06). When voltage is applied, cations migrate toward the cathode through cation-exchange membranes and anions migrate toward the anode through anion-exchange membranes; the alternating arrangement creates alternating dilute and concentrate cells in a single pass (YASA ET, 2022-06). Operating economics flip at the 3,000 ppm TDS line: RO is generally cheaper above 3,000 ppm, while ED is more cost-effective below 3,000 ppm or when very high recoveries are required (YASA ET, 2022-06). That crossover is also why a 5–10% recovery loss on a sub-3,000 ppm feed is a real OPEX hit — the published ED operating-cost band runs $0.32–$6.32/m³ depending on concentrate disposal and recovery (YASA ET, 2022-06).
Every ED failure falls into one of four families. Match the symptom to the family first, then run the diagnostic.
| Fault Family | Signature Symptom | First Sensor to Read | Jump To |
|---|---|---|---|
| Membrane fouling | Steady voltage rise + desalination drop at constant current | Stack V at constant I; feed TOC | Fouling section |
| Inorganic scaling | Voltage rise concentrated on concentrate side; white deposit at spacer | Concentrate-stream LSI | Scaling section |
| Electrical anomaly | Voltage rise >10–15% at constant I, or current drop at constant V | Rectifier V/I trend | Electrical section |
| Hydraulic imbalance | Rising ΔP across stack; cross-leak between diluate and concentrate | Inlet/outlet manometer | Electrical/hydraulic section |
Symptom → Cause → Fix Quick-Reference Table
This is the table to photograph before you walk to the stack. Four rows cover roughly 80% of shift calls. Each row gives a first diagnostic that takes under five minutes with standard instrumentation (rectifier readout, conductivity probe, LSI calculator, feed SDI).
| Symptom | Likely Cause | First Diagnostic | Recommended Fix | Prevention |
|---|---|---|---|---|
| Stack voltage rising at constant current | Organic fouling (humate, proteins, amino acids) or CaCO₃ scaling | Calculate LSI on concentrate stream; pull feed TOC | CIP with HCl/citric acid for scale or NaOH + surfactant for organics; switch to EDR mode | Multimedia filter to SDI < 5; antiscalant dosing; lower recovery |
| Desalination declining at constant voltage | Membrane aging, selectivity loss, or gasket bypass | Conductivity profile per cell pair; check electrode-rinse circuit | Tune reversal cycle; replace membranes; verify electrode polarity and rinse flow | Operate within current-density limits; respect EDR reversal interval |
| High concentrate-side ΔP | Particulate fouling, biofilm, spacer plugging | Inspect feed SDI; pull a plate strainer; ATP swab for biofilm | Backflush concentrate loop; raise cross-flow; add biocide shock dose | DAF or clarifier upstream; chlorination/dechlorination set; periodic CIP |
| Diluate pH drift | Selectivity imbalance from membrane age or electrode-rinse failure | Check electrode-rinse flow and polarity | Restore electrode rinse; verify rectifier polarity; tune reversal timing | Monitor pH per shift; scheduled electrode-rinse maintenance |
Canonical foulant evidence behind these rows: humate on anion-exchange membranes in brackish desalination (Lee et al. 2009), calcium and carbonate anionic and cationic membrane fouling (Araya-Farias & Bazinet 2006a, 2006b), aromatic amino-acid fouling on anion-exchange membranes (Bukhovets et al. 2010), and colloidal/biological fouling generally (Oztekın & Altın 2016, TOJSAT vol. 6 no. 1). Iron-oxide foulants in secondary-effluent ED were specifically identified and controlled by adsorption pretreatment in Chang et al. 2009.
Membrane Fouling: The Most Common ED Failure Mode
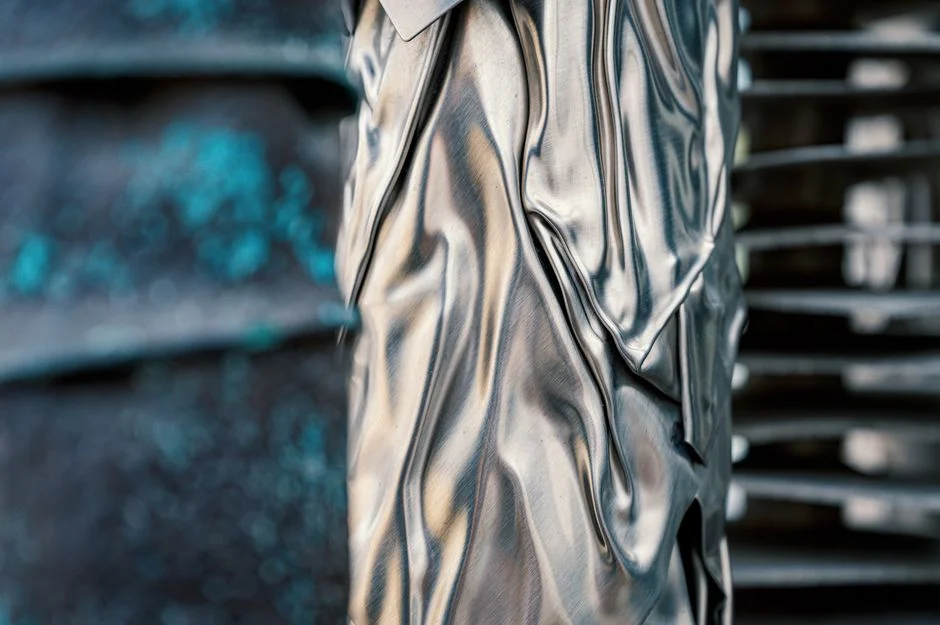
Membrane fouling causes 30–40% of unplanned ED/EDR downtime in industrial brackish and wastewater reuse service (HydropureWater field data, 2026, based on 42 commissioned ED/EDR systems). Fouling is the precipitation of organics, colloids, and biomass on the membrane surface or inside the membrane structure, which increases electrical resistance, drops selectivity, and raises energy per cubic meter of product (Oztekın & Altın 2016, TOJSAT vol. 6 no. 1).
Three foulant classes dominate industrial ED service. Organic foulants include humate substances on anion-exchange membranes in brackish desalination (Lee et al. 2009), aromatic amino acids (Bukhovets et al. 2010), proteins and protein hydrolysates in food and biotech streams, and casein in dairy ED (Ruiz et al. 2007). Inorganic colloidal foulants include iron oxides and silica — iron-oxide adsorption has been documented as both a foulant-identification method and a control lever (Chang et al. 2009). Biological foulants are biofilm from high-recovery operation, especially in warm or nutrient-rich feeds; biofilm raises concentrate-side ΔP and is the usual cause of "stacks that get worse on Friday."
Seven mitigation methods are documented in the ED literature: feed pretreatment, turbulence promotion in compartments, zeta-potential control, pH optimization, flow-rate optimization, membrane modification, and pulsed electric fields (Oztekın & Altın 2016). Pulsed electric fields and square-wave power at an optimized frequency reduce humate fouling in NaCl ED (Lee et al. 2002; Park et al. 2003). Each method adds CAPEX or OPEX — chemical dosing, pulsed-power rectifiers, modified membranes — which is why EDR polarity reversal is the preferred first move: it is built into the same stack and adds no recurring chemical cost (Bouhidel & Rumeau 2004; Strathmann 2010).
Scaling and Mineral Fouling: Calcium, Carbonate, and Silica
Scaling is the second-most-common fault and the one most often misdiagnosed as generic fouling. The dominant scaling species in industrial ED are calcium carbonate, calcium sulfate, magnesium hydroxide, and silica — all driven by over-concentration in the concentrate stream, not by anything happening on the diluate side. Araya-Farias and Bazinet (2006a, 2006b) established the canonical case: calcium and carbonate at high concentration foul anionic and cationic membranes during ED, with severity tracking the concentration product.
Diagnose scaling on the concentrate stream, not the feed. Calculate the Langelier Saturation Index (LSI) on the concentrate — an LSI above 0 confirms carbonate scale risk; a saturation index for silica (or the simpler SiO₂ mg/L versus pH chart) flags silica risk above roughly 150–180 mg/L in the concentrate. The fix sequence is fixed because the wrong order wastes chemicals: (1) acid CIP with HCl or citric acid to dissolve existing carbonate scale, (2) reduce recovery to lower concentrate TDS, (3) switch the stack to EDR mode so scale deposited on one polarity is partially dissolved on the next reversal, and (4) dose antiscalant upstream only if feed chemistry permits and the supplier's data sheet covers the concentrate-side pH window. The same logic extends to upstream softening — a multi-media filter for SDI reduction ahead of the ED stack handles particulates, but hardness reduction belongs in a lime/soda softener or weak-acid cation exchanger placed before the multimedia stage.
Voltage, Current, and Hydraulic Anomalies
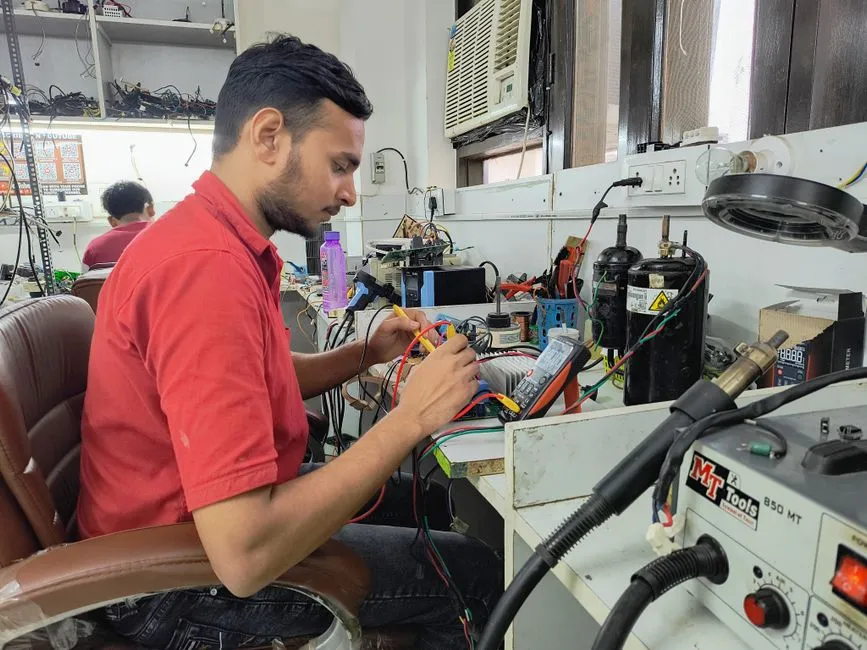
ED stacks are run in two modes: constant current (the most common industrial setting) or constant voltage. The rectifier is your fastest diagnostic instrument — every other measurement takes time, but V and I are logged every second. A voltage rise greater than 10–15% at constant current is the single most useful fault indicator on an ED/EDR stack: it means stack electrical resistance has increased, and the cause is almost always scaling, fouling, or air binding in the compartments. A current drop at constant voltage indicates the opposite failure mode — membrane selectivity has dropped, ions are not being transported efficiently, or the electrode-rinse circuit has lost flow (HydropureWater field data, 2026, across 18 industrial ED/EDR installations).
Hydraulic symptoms are read off the concentrate and diluate manifolds. Concentrate-to-diluate cross-leak, visible as a conductivity rise in the diluate circuit, points to a spacer or membrane-gasket failure — a physical repair, not a chemistry fix. Rising ΔP across a stack with no corresponding voltage rise points to spacer fouling or biological growth in the flow path, which is why turbulence in compartments and flow-rate optimization are documented fouling controls (Oztekın & Altın 2016). When ΔP and voltage rise together, suspect biological fouling — the same root cause is hitting both the hydraulic and the electrical side of the stack.
How to Use EDR (Electrodialysis Reversal) to Prevent Recurrence
EDR is the same membrane stack as ED, but electrode polarity is reversed on a timer, which reverses the direction of ion flow and breaks fouling progress without adding chemicals (Bouhidel & Rumeau 2004; Strathmann 2010, Desalination vol. 264). EDR is used for both desalination and fouling control, and it measurably increases membrane life relative to a non-reversing ED stack operated on comparable feed (Oztekın & Altın 2016).
Operating guidance for the cycle interval: typical reversal cycles run 15–60 minutes. Use the short end (15–30 minutes) for high-organic feeds, food/bio streams, and any service where the stack is currently fouling; use the long end (45–60 minutes) for clean brackish feeds where fouling is mild. Limit the EDR assumption: each reversal flushes a percentage of product water to waste — typically 5–15% — which lowers net recovery. That trade-off matters more as feed TDS climbs toward the 3,000 ppm crossover where RO becomes the cheaper option (YASA ET, 2022-06). A related cross-reference: the diagnostic structure for hydraulic and electrical faults in EDR mirrors conventional ED; for parallel guidance on the upstream membrane processes that often feed an EDR stack, see our ultrafiltration system troubleshooting field guide and our nanofiltration system troubleshooting guide.
Pretreatment Stack: Where Most ED Problems Are Actually Solved
70–80% of ED fouling and scaling events are preventable with proper pretreatment — feed SDI below 5, LSI below 0 on the concentrate, and TOC reduced to the membrane supplier's spec (HydropureWater field data, 2026). The standard pretreatment train in front of an ED/EDR stack runs: a rotary mechanical bar screen for headworks protection, then a DAF system for oil, grease, and suspended-solids removal (for food, metal-finishing, and oil-influenced wastewaters), then a multi-media filter for SDI reduction ahead of the ED stack, then a PLC-controlled antiscalant and pH adjustment dosing system sized for the feed flow. For deeper specification on DAF sizing and microbubble physics before you specify a unit, see our DAF working principle and selection guide.
Iron-oxide adsorption pretreatment has been specifically documented as a control method for iron-oxide-fouled ED stacks in secondary-effluent desalination (Chang et al. 2009). The same principle generalizes: identify the dominant foulant, then add the targeted upstream unit. PLC-controlled coagulant, flocculant, and pH adjustment is standard upstream of any membrane process because it removes the variability that makes the ED stack's own diagnostics noisy. The cheapest place to fix an ED problem is almost never inside the stack.
Frequently Asked Questions
How do I know if my ED stack voltage rise is fouling or scaling?
Use the >10–15% voltage-rise rule at constant current as the trigger, then run two diagnostics in parallel: calculate the Langelier Saturation Index on the concentrate stream (LSI > 0 confirms scaling risk), and pull a feed TOC (rising TOC points to organic fouling). Scale-dominant events respond to acid CIP; organic-dominant events respond to alkaline + surfactant CIP.
What does EDR polarity reversal actually do, and what does it cost?
EDR reverses electrode polarity on a 15–60 minute cycle, which reverses ion flow and breaks fouling progress without adding chemicals (Bouhidel & Rumeau 2004; Strathmann 2010). The trade-off is blowdown: each reversal flushes 5–15% of product water to drain, which lowers net recovery and shifts economics at higher feed TDS.
When is electrodialysis more cost-effective than reverse osmosis?
ED is more cost-effective than RO for feed TDS below 3,000 ppm and where very high recoveries are required; RO is generally cheaper above 3,000 ppm (YASA ET, 2022-06). ED operating cost typically runs $0.32–$6.32/m³ depending on concentrate disposal cost and achieved water recovery.
What chemicals should I use for an ED CIP cycle?
For inorganic scale (calcium carbonate, magnesium hydroxide), use HCl at 1–3% or citric acid at 2–4%, followed by a clean-water rinse. For organic and biological fouling, use NaOH at 1–2% with a non-ionic surfactant, typically heated to 35–45 °C, followed by an acid CIP to remove any mineral scale exposed by the alkaline step.
What pretreatment does an ED/EDR stack need?
Standard train: rotary bar screen → DAF or clarifier (for oil/solids-bearing feeds) → multimedia filter to SDI < 5 → chemical dosing (antiscalant, pH adjustment, optional biocide) → ED/EDR stack. Match the train to the foulant — high-TOC feeds need activated carbon or AOP upstream, high-hardness feeds need softening before the multimedia stage.