
Why a Dairy Plant Expansion Forces an ETP Redesign
Adding a new pasteurized milk, yogurt, or cheese line shifts the BOD/COD profile upward, raises the FOG fraction, and introduces new CIP chemical peaks that the original biological stage was not sized for. The dairy sector is one of the most water-intensive food industries, generating large volumes of wastewater rich in organic matter, cleaning agents, and fats per unit of production (PMG Engineering, 2022). When throughput rises, the wastewater rises faster, because milk intake, processing, and CIP volumes all scale with capacity.
An ETP that was compliant at 80% hydraulic load will routinely fail BOD, TSS, or FOG limits once it crosses roughly 120% load. Re-running the influent characterization is the first engineering step, not a procurement formality: dairy effluent varies sharply across milk reception, pasteurization, cheese whey, and CIP streams, and seasonal milk intake swings the load by 20–40% over the year. Designing for the old average means the new peak overwhelms the equalization tank and starves the biological stage of the stable feed it needs to hold discharge consent.
Dairy Effluent Characteristics After Expansion: What Changes in the Influent
Expanded dairy plants generate four distinct waste streams, each pushing a different parameter on the design engineer. Milk reception wash water carries high BOD/COD and suspended solids from spillage and tank rinsing. Processing wastewater from pasteurization and homogenization adds heat and dissolved organics. Product-specific streams — cheese whey, yogurt brine, butter wash — spike the BOD and the salt load simultaneously. CIP chemical effluent alternates acid and alkaline cleaning cycles, causing pH swings of 2–3 units inside a single shift and making biological stage stability a first-order design driver.
Per Awetech Works (2026), dairy effluents contain high organic matter, nutrients, FOG, and pathogens, and expansion amplifies every one of these vectors. Nitrogen originates primarily from milk proteins (casein and whey), phosphorus from phosphate-based cleaning agents, and suspended solids from curd fines and casein carryover. FOG is the parameter that most often forces a pretreatment stage upstream of biology, because free fats coat biomass and destroy nitrification efficiency if they reach the aeration tank unskimmed.
| Parameter | Pre-expansion Typical Range | Post-expansion Typical Range | Design Driver |
|---|---|---|---|
| BOD (mg/L) | 800–1,500 | 1,500–3,000 | Reactor volume, biogas yield |
| COD (mg/L) | 1,500–3,000 | 3,000–6,000 | Aeration demand, F/M ratio |
| FOG (mg/L) | 100–300 | 300–800 | DAF sizing, sludge handling |
| TSS (mg/L) | 300–600 | 600–1,200 | Equalization, primary clarification |
| Total Nitrogen (mg/L) | 40–80 | 70–140 | Nitrification/denitrification volume |
| Total Phosphorus (mg/L) | 10–25 | 20–50 | Biological or chemical P removal |
| pH | 6.5–8.5 | 4.5–10.0 (with CIP peaks) | Equalization capacity, neutralization |
The 2026 Process Train Danone's Expanded ETP Should Follow
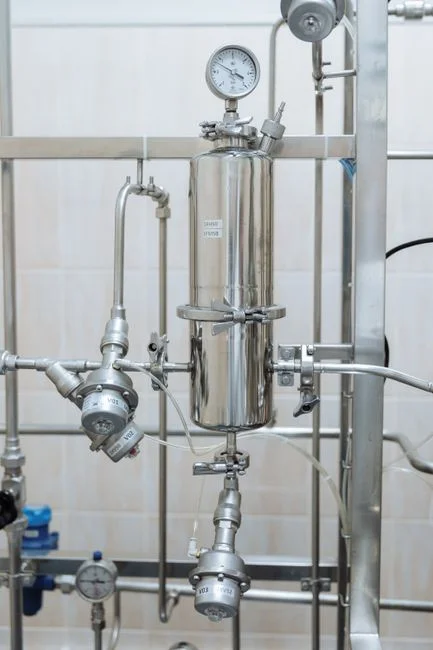
The recommended flow for a brownfield dairy ETP expansion runs seven sequential stages plus a sludge side stream, with each stage performing a specific engineering function required by the next.
Stage 1 — Screening and equalization. Rotary bar screens (2–6 mm aperture) remove solids that would otherwise blind downstream equipment. The equalization tank that follows is sized for 6–12 hours of hydraulic retention to dampen flow and concentration swings from batch CIP and seasonal milk intake. Without this buffer, the biological stage sees shock loads and loses nitrification.
Stage 2 — FOG and suspended solids removal via DAF for FOG and suspended solids removal. DAF is the standard primary stage for dairy FOG (Awetech Works, 2026); micro-bubble flotation skims fats before they coat biomass, and a properly sized DAF typically achieves 60–90% FOG removal and 50–70% TSS removal in dairy service. Hydraulically, a 20–40 minute retention in the flotation cell is the order-of-magnitude design range.
Stage 3 — High-rate anaerobic digestion (UASB or IC reactor). Awetech Works (2026) describes biological treatment as aerobic or anaerobic; for expanded dairy, anaerobic is the preferred default because the post-expansion BOD load is high enough to make biogas-to-energy payback a real line item on the project financial model. A UASB or IC reactor handles the bulk of the carbon reduction with minimal energy input.
Stage 4 — Aerobic biological treatment (SBR or MBR). Residual BOD/COD and ammonia are reduced here. PMG Engineering (2022) notes that continuous monitoring is essential, and PLC/SCADA integration on this stage is the difference between stable compliance and permit excursions.
Stage 5 — Nutrient removal. Biological nitrogen and phosphorus removal prevents eutrophication in the receiving water and is required by most state pollution control board consents for dairy discharges above a defined hydraulic threshold (Awetech Works, 2026).
Stage 6 — Membrane polish. UF, optionally followed by RO, is included when reuse-grade water is required or when discharge TDS limits are tight (Awetech Works, 2026).
Stage 7 — Disinfection. Chlorination, UV, or ozone delivers the final pathogen kill before discharge or reuse (Awetech Works, 2026).
Side stream — sludge dewatering. A plate-and-frame filter press drops sludge moisture to 60–70% TS for cake handling and bio-solids reuse, closing the mass balance.
Choosing the Right Biological Reactor for an Expanded Dairy Plant
The single most consequential design decision in an expansion project is the biological reactor choice, as the selection determines 15–20 years of operating cost and compliance risk. Four options dominate the dairy ETP conversation, trading off CAPEX, footprint, energy, and reuse potential.
Conventional Activated Sludge (ASP). Lowest CAPEX, largest footprint, sensitive to FOG and load spikes. It is a poor fit for an expansion unless land is unconstrained and the operator has a stable influent.
Sequencing Batch Reactor (SBR). Better load tolerance and smaller footprint than ASP, with batch flexibility that handles variable influent. Fits medium expansions where influent swings are real but land is still available.
Membrane Bioreactor (MBR). Smallest footprint with near-reuse-quality effluent (typically <50 mg/L COD, <5 mg/L TSS), though it involves higher membrane cost and aeration energy. Best fit when space is tight or the project targets water reuse for cooling tower or boiler makeup.
UASB + MBR hybrid. Anaerobic front-end cuts aeration energy via biogas; MBR polish handles residual organics and ammonia to reuse quality. This is the configuration recommended for energy-recovery projects.
| Reactor Option | BOD/COD Removal | Relative Footprint | Energy Profile | CAPEX Band | Best Fit for Expansion |
|---|---|---|---|---|---|
| Conventional ASP | 90–95% BOD | Large | High aeration | Low | Land-rich, stable load |
| SBR | 90–95% BOD | Medium | Medium-high | Medium | Variable influent, medium scale |
| MBR (alone) | 95–99% BOD, <50 mg/L COD effluent | Small | High (membrane + aeration) | High | Space-constrained, reuse priority |
| UASB + MBR | 95–99% BOD, biogas recovery | Small-medium | Low net (biogas offsets) | High | High-load, energy-recovery priority |
High organic load plus energy-recovery priority points to an integrated MBR system for the biological polish stage paired with a UASB front-end. Space-constrained projects targeting reuse can run MBR alone, while budget-constrained projects with land available can accept SBR. Further detail on cost and ROI is covered in this MBR cost and ROI analysis for food processors.
Sizing the ETP for Expansion: The Capacity-Scaling Logic
Capacity must be anchored in peak daily flow and peak BOD load, not the average; dairy plants run morning CIP peaks that are 2–3× the daily average, requiring the equalization tank and biological stage to absorb these shocks without losing nitrification. Awetech Works (2026) frames the design philosophy around three inputs: future expansion headroom, end-use of treated water, and water depletion rate, all of which should be quantified before vendor engagement.
Engineers should add a 20–30% design margin above the calculated peak so the next capacity increase does not trigger another redesign. Dairy-specific design heuristics include DAF hydraulic retention in the 20–40 minute range, UASB upflow velocity around 0.7–1.5 m/h, and MBR mixed liquor suspended solids in the 8–12 g/L band. The reuse quality target — turbidity below 1 NTU and COD below 50 mg/L — is what forces UF/RO downstream of the biological stage, and it should be set during scoping.
Compliance, Reuse, and the Biogas ROI Argument
Adherence to local pollution control board discharge limits is the non-negotiable baseline. A UASB+MBR+UV train typically clears BOD, TSS, FOG, and fecal coliform limits for inland surface discharge and is the configuration most state regulators are familiar with for dairy capacity above 100 KL/day. Beyond compliance, water reuse turns the ETP from a cost center into a process input; MBR+RO polish can route treated effluent to cooling tower makeup, boiler feed, or yard wash, shortening project payback by 1–2 years.
Biogas recovery is the third economic pillar. Anaerobic digestion converts the expanded BOD load into usable methane, and depending on electricity tariffs and on-site thermal demand, the energy offset provides a 5–8 year payback lever on expansion CAPEX, as documented in this wastewater treatment maintenance cost planning guide. PMG Engineering (2022) and Awetech Works (2026) both call out real-time PLC/SCADA monitoring as the operational discipline that protects the investment; without it, membrane fouling, biomass washout, and permit excursions erode the financial case.
Frequently Asked Questions
What biological reactor is best for an expanded dairy ETP?
A UASB + MBR hybrid is the strongest default for an expanded dairy plant because the anaerobic front-end converts the high post-expansion BOD load into biogas while cutting aeration energy, and the MBR polish delivers reuse-quality effluent with a small footprint. Conventional ASP and SBR remain defensible when land is unconstrained and reuse is not a project goal.
Why is DAF used before biological treatment in a dairy ETP?
DAF removes 60–90% of FOG and 50–70% of TSS upstream of the biological stage, which prevents fats from coating biomass and protects nitrification efficiency. Without DAF, free oil and grease suppress the microbes that convert ammonia, and the plant will fail nitrogen limits even when BOD and TSS are compliant.
How much design margin should be added when scaling a dairy ETP for expansion?
Engineers should size reactors for peak flow and peak BOD load, not the annual average, and then add a 20–30% margin on top of the calculated peak so the next capacity increment does not force another redesign. Morning CIP peaks