Why Pesticide Wastewater Demands a Dedicated Dosing Design
Pesticide formulation and technical-grade active-ingredient plants generate an effluent profile that breaks any dosing logic lifted from a municipal plant. Typical streams arrive at the dosing skid with COD of 5,000–30,000 mg/L, BOD₅/COD below 0.3 (poorly biodegradable), color between 500 and 5,000 Pt-Co units, pH swings from 2 to 11 across batch campaigns, and salinity of 1–5% from process water and formulation byproducts (HydropureWater field data, 2026). The pollutant mix is refractory by design: organophosphates such as chlorpyrifos and glyphosate intermediates, synthetic pyrethroids, carbamates, chlorinated aromatics, and benzene-ring intermediates from active-ingredient synthesis each carry a different electron-demand and require a different oxidant stoichiometry.
Municipal-style dosing — a simple ferric chloride feed for phosphorus, a polymer for sludge, a chlorine residual for disinfection — fails on three counts. First, pesticide molecules resist biological breakdown, so advanced oxidation reagents (Fenton, ozone, ClO₂) carry the load and require precise stoichiometric control within ±5% of setpoint. Second, the salinity and chloride content attack SS304 and even SS316 wetted parts, forcing PP or PVDF selection. Third, under-dosing sends toxic breakthrough to downstream biological or membrane stages and risks product recall from contaminated receiving water; over-dosing wastes reagent, generates excess iron sludge, leaves residual chlorine above 2026 China GB 21523 limits, and pushes the plant outside its discharge permit. Generic dosing pages stop at "add chemicals into wastewater." The rest of this guide is the engineering that fills that gap.
Reagent Matrix: What to Dose, Where, and at What Rate
The reagent matrix below is the starting design point for a 200–500 m³/day pesticide formulation plant, sized for the COD window 5,000–30,000 mg/L. Adjust setpoints against actual jar-test data before finalizing P&IDs.
| Stage | Reagent | Typical Dose | Setpoint / Target | Reaction / Notes |
|---|---|---|---|---|
| pH correction (pre-Fenton) | 10% NaOH or 5–10% lime slurry | 500–2,000 mg/L as CaCO₃ equivalent | pH 3.0 ± 0.2 | Tied to PTFE pH probe in equalization tank; PID loop, 30–60 s response |
| Fenton oxidation | 30% H₂O₂ + FeSO₄·7H₂O | 1,000–5,000 mg/L H₂O₂; 200–1,000 mg/L Fe²⁺ | H₂O₂:Fe²⁺ molar ratio 5–10:1; 60–85% COD removal | 30–90 min reaction; quench to pH 7–8 with NaOH before coagulation |
| Coagulation | PAC (polyaluminum chloride, 10% Al₂O₃) | 50–300 mg/L | Turbidity <50 NTU after 15 min settling | Flash mix 200 rpm for 60 s |
| Flocculation | Anionic PAM (molecular weight 8–12 MDa) | 1–5 mg/L | Visible floc, settle rate ≥2 m/h | Slow mix 30–50 rpm for 10–15 min |
| Disinfection / polishing oxidation | NaClO (10–13% active Cl) or ClO₂ | 20–80 mg/L as Cl₂; ClO₂ 5–15 mg/L | ORP 600–700 mV; residual pesticide <0.1 mg/L | CT 30 min minimum; double-contained piping |
| AOP polishing (chlorpyrifos, neonicotinoids) | Zero-valent iron (ZVI) or Na₂S₂O₈ (persulfate) | 1–5 g/L ZVI; 0.5–2 g/L persulfate | Organophosphorus <0.1 mg/L per EU BREF 2026 | Heat-activated (40–55 °C) or Fe²⁻-activated; emerging 2025–2026 practice |
Fenton's reagent is the workhorse for refractory organics because ·OH radicals (E° = 2.80 V) attack the aromatic ring and P=S bonds that biology cannot crack. Persulfate activation with ZVI is gaining traction in 2025–2026 installations where chlorpyrifos or imidacloprid breakthrough persists after Fenton — the SO₄⁻· radical pathway is more selective for electron-rich aromatics and tolerates higher salinity than ·OH (per recent peer-reviewed AOP studies). For the broader oxidation train, see the AOP system engineering guide for chemical wastewater.
Dosing Subsystem Architecture and Component Selection
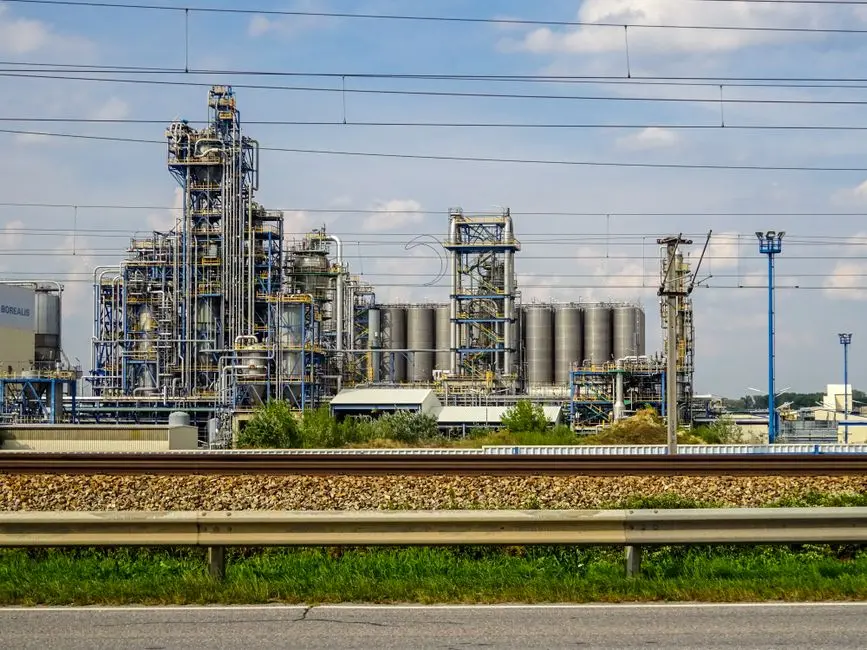
A pesticide-service dosing skid is a PLC-controlled assembly of storage tanks, day tanks, transfer pumps, metering pumps, mixers, instrumentation, and double-contained chemical piping. The component map below is what a project engineer should carry into a P&ID review.
| Component | Specification | Material / Standard | Selection Logic |
|---|---|---|---|
| Bulk storage tanks | 5–7 days reagent consumption; HDPE day tank at 1–2 m³ | HDPE or PP-lined CS for NaOH/HCl; FRP for H₂O₂; XLPE for NaClO | NaClO degrades standard PP and HDPE — XLPE or PVDF-lined mandatory |
| Dosing pump technology | Solenoid diaphragm <50 L/h; mechanical diaphragm 50–500 L/h; peristaltic for slurries | PP, PVDF, or PTFE wetted | SS316 acceptable only for clean NaOH and PAM; SS304 banned on any chloride-bearing reagent |
| Static mixers | 3–6 elements, 2–4 pipe diameters length | PVDF or PP-H, PTFE internals for HF-bearing service | Inline reagent injection into pressurized lines; ≤0.5 bar pressure drop |
| Tank agitators | 30–60 rpm slow-speed; 1–3 kW/m³ | PP- or PVDF-coated shaft, PTFE blades | Prevents PAC/PAM settling; maintains H₂O₂ homogeneity |
| Chemical piping | DN15–DN50, socket fusion or flanged | PE100 or PP-H; double-contained PP-in-PVC for NaClO | Color-coded per ISO 14726; sodium hypochlorite lines must avoid elastomers containing EPDM |
| Containment bunding | 110% of largest tank volume | Concrete with sodium silicate coating; HDPE liner | Bunding level switch interlocked to all chemical feed pumps |
The storage-tank sizing rule of 5–7 days is not a budget cushion — it bridges reagent-truck delivery intervals (typically weekly in inland China and India) and prevents the most common cause of permit excursion, which is an empty tank during a batch discharge. For plants in coastal or high-temperature regions, NaClO bulk storage drops to 3–5 days because 10–13% active chlorine loses 1–2% available chlorine per week above 30 °C.
Dosing Pump Comparison for Pesticide Service
Pump selection drives both CAPEX and OPEX more than any other skid component. The matrix below consolidates flow range, pressure rating, accuracy, viscosity tolerance, solids handling, maintenance interval, and 2026 skid-mounted pricing into a single decision table a procurement manager can lift directly into an RFQ. A complete skid-mounted PLC automatic chemical dosing system integrates the selected pump technology with tanks, mixers, instruments, and a control panel.
| Pump Type | Flow Range | Max Pressure | Accuracy | Viscosity / Solids | Maintenance Interval | 2026 Indicative Unit Cost (USD) | Best-Fit Service |
|---|---|---|---|---|---|---|---|
| Solenoid diaphragm | 0.1–50 L/h | 16 bar | ±1–2% | Low viscosity, <1% solids | Diaphragm 4,000–6,000 h | 800–2,500 | Clean acid / alkali, low-flow NaOH, antiscalant |
| Mechanical (motor-driven) diaphragm | 10–500 L/h | 12 bar | ±1% | Up to 500 cP, <3% solids | Diaphragm 8,000–12,000 h | 2,500–8,000 | Fenton H₂O₂, FeSO₄, NaClO at moderate pressure |
| Peristaltic (hose pump) | 0.1–30 m³/h | 16 bar | ±1–2% | Up to 20,000 cP, <30% solids | Hose 800–1,500 h (15 min swap) | 3,000–15,000 | PAC slurry, PAM emulsion, lime, any slurry >5% solids |
| Plunger (metering) | 5–2,000 L/h | 100+ bar | ±0.5% | Clean, low viscosity only | Packing 2,000–4,000 h | 4,000–20,000 | High-pressure injection into >10 bar lines (e.g., RO feed) |
Peristaltic pumps have dominated 2025–2026 procurement in Chinese pesticide plants because the maintenance event is a 15-minute hose change rather than a half-day diaphragm and valve-head rebuild. For slurries above 5% solids — PAC at 10% suspension, lime slurry, polyacrylamide emulsion — no diaphragm pump is field-reliable; specify peristaltic. Reserve plunger metering pumps for high-pressure injection points where diaphragm pumps cannot develop the head.
Instrumentation and PLC Control Logic
The dosing skid is only as accurate as the loop that drives it. A pesticide-service instrument package must include PTFE-bodied pH probes rated for high-impurity tolerance, ORP sensors with platinum junctions, inline conductivity, magnetic flow meters on every chemical line, and level switches with low-low interlocks in each storage and day tank. NaClO service demands ORP-tolerant reference junctions; standard KCl-filled probes fail within days.
The control logic follows three loops. A PID loop on pH drives acid or alkali dosing against a setpoint of 3.0 for Fenton feed and 7.0–8.0 for the post-Fenton quench. A feedforward loop calculates the Fenton demand from influent flow × COD load, using a rule-based L H₂O₂/kg COD ratio (typically 0.5–1.5 kg H₂O₂ per kg COD removed for 60–85% removal) modulated by an ORP trim signal. An on/off loop ties NaClO or ClO₂ feed to an ORP setpoint of 600–700 mV. PLC platforms of choice in 2026 are Siemens S7-1200/1500 and Allen-Bradley CompactLogix with 7–10 inch HMIs, integrating to plant DCS via Modbus TCP or OPC UA.
Safety interlocks are non-negotiable: tank low-low stops the pump; line pressure low raises a leak alarm; cabinet door E-stop cuts all chemical feed; bunding level switch shuts the skid entirely. The 2026 trend worth flagging is AI-driven reagent optimization, where ML models trained on 6–12 months of influent variability reduce chemical OPEX 10–20% over rule-based PID by anticipating batch discharges from the production schedule (industry case data, 2026).
2026 CAPEX and OPEX Benchmarks
The 2026 cost ranges below are skid-delivered, USD-equivalent, and inclusive of tanks, pumps, control panel, instruments, and installation. They exclude civil works, biological or membrane stages downstream, and reagent inventory. For a complete skid-mounted PLC automatic chemical dosing system package, anchor budget reviews to these bands.
| Plant Capacity | CAPEX Range (USD, 2026) | Main OPEX Drivers | Annual Reagent Cost Example |
|---|---|---|---|
| 50 m³/day | 15,000–30,000 | Reagent 65%, maintenance 12%, labor 13%, sensors 10% | USD 30,000–50,000 |
| 100–500 m³/day | 35,000–120,000 | Reagent 70%, maintenance 10%, labor 11%, sensors 9% | USD 90,000–280,000 |
| 500–2,000 m³/day | 120,000–400,000 | Reagent 75%, maintenance 8%, labor 9%, sensors 8% | USD 250,000–900,000 |
Worked example for the 500 m³/day band: influent COD 15,000 mg/L, Fenton removal 80%, H₂O₂ dose 0.8 kg per kg COD removed, 30% H₂O₂ spot price USD 350–450/t in China (Q1 2026). Annual H₂O₂ consumption lands at approximately 1,750 t of 30% solution, or USD 180,000–250,000 in reagent spend. PAC and PAM add another 15–25% on top; NaClO and NaOH account for the residual. The financial case for automatic PLC dosing versus manual batch is consistent: 15–30% chemical savings with a 1.5–3 year payback on the skid cost alone, validated across multiple Chinese formulation plants in 2024–2025 retrofits.
Compliance Map: 2026 Effluent Standards That Drive Dosing Targets
Dosing setpoints are not arbitrary — each one is the answer to a regulatory number on the discharge permit. Reverse-engineer the reagent matrix from the limits, not the other way around.
China GB 21523-2024 (enforced from 2026) sets COD ≤500 mg/L, ammonia ≤45 mg/L, total phosphorus ≤8 mg/L, and pH 6–9 for the pesticide industry discharge category. The EU BREF on Common Waste Water and Waste Gas Treatment (2026 update) tightens direct-discharge COD to ≤250 mg/L and requires total organophosphorus monitoring on plants above 100 m³/day. India CPCB/EPA pesticide industry standards hold COD ≤250 mg/L and require individual pesticide residues below 0.1 mg/L for select compounds. The mapping is direct: Fenton's reagent carries the COD load; NaOH and lime set the pH window; NaClO and ClO₂ strip residual pesticide and color to below the EU and India thresholds. For plants exporting to multiple jurisdictions, design to the tightest applicable number — usually the EU BREF organophosphorus ceiling — and the other two regimes fall inside it.
For procurement readers budgeting across multiple sites, the 2026 process-and-compliance cost picture varies significantly by jurisdiction; the chemical wastewater treatment in Brazil process and compliance guide covers one of the most active 2026 export markets. And once dosing and oxidation are stabilized, the downstream solids-handling stage — typically a filter press — becomes the next pinch point; the filter press installation and commissioning field guide covers that handoff.
Frequently Asked Questions
What dose of Fenton's reagent removes 80% of COD in pesticide effluent?
For influent COD 15,000 mg/L, a H₂O₂ dose of 1,000–5,000 mg/L (as 30% solution) with FeSO₄·7H₂O at 200–1,000 mg/L achieves 60–85% COD removal in 30–90 minutes at pH 3.0. The H₂O₂:Fe²⁺ molar ratio should be held between 5:1 and 10:1 to maximize ·OH yield without quenching the catalyst (HydropureWater field data, 2026).
Why are PP or PVDF dosing pumps required instead of SS316 for pesticide wastewater service?
Pesticide effluent typically carries 1–5% salinity and chloride-bearing reagents (NaClO, HCl, FeCl₃). SS316 suffers pitting and crevice corrosion above 200 ppm Cl⁻ at >40 °C; SS304 fails faster. PP, PVDF, and PTFE wetted materials resist chloride-induced attack across the full pH and temperature range of pesticide dosing service.
What is the typical 2026 CAPEX for an automatic dosing skid at a 200 m³/day pesticide plant?
A 200 m³/day plant falls in the USD 35,000–120,000 band for a complete skid including tanks, pumps, instruments, and PLC. OPEX is dominated by reagent (60–75% of annual cost), with H₂O₂ alone reaching USD 180,000–250,000 per year for a 500 m³/day plant at 80% Fenton removal.
Which dosing stage delivers compliance against China GB 21523-2024?
Fenton's reagent drives COD from 5,000–30,000 mg/L down to the 500 mg/L GB limit; NaOH or lime maintains pH 6–9; NaClO or ClO₂ handles residual pesticide and color before biological or membrane polishing. Total phosphorus below 8 mg/L is typically met by the Fenton-iron sludge separation stage rather than a dedicated precipitant.
Is NaClO or ClO₂ preferred for pesticide residue destruction?
ClO₂ at 5–15 mg/L is more selective for electron-rich aromatic and organophosphorus structures and produces fewer chlorinated byproducts than NaClO at 20–80 mg/L. For plants constrained by India CPCB or EU BREF on total organochlorine byproducts, ClO₂ is the 2026 default despite higher unit cost.