Why Constructed Wetland Maintenance Matters More in 2026
Global wastewater generation reached an estimated 360–380 billion m³/yr as of 2024, with roughly 48% discharged untreated. Most constructed wetlands (CWs) are sized for compliance, not throughput, meaning any hydraulic or biological degradation is felt within a single operating season (Nature, 2024). A bed that shifts from a passive treatment asset to an emergency OPEX event in one wet winter is not unusual: a clogged subsurface flow wetland can lose 40–60% of its design hydraulic loading rate within 18 months of neglect, according to operating data from municipal sludge dewatering comparisons (per industry field data, 2025). The 2026 regulatory pressure compounds the problem: tightening nutrient limits—TN <10 mg/L in many EU and US permits, TP <0.5 mg/L in reclamation zones—leave no margin for untreated short-circuiting through a partially failed bed. Maintenance is the lowest-cost insurance for the 20–30 year design life a CW is sold on, yet it remains the single most under-budgeted line item in municipal O&M contracts.
The 7 Maintenance Pillars of a Constructed Wetland
Seven operational pillars cover the requirements for keeping any CW configuration—subsurface flow (SSF), free water surface (FWS), vertical flow (VF), or hybrid—performing at design removal rates. This framework links each maintenance action to a frequency, a measurable outcome, and a typical cost range.
| Pillar | Core Action | Typical Frequency | Measurable Outcome |
|---|---|---|---|
| 1. Hydraulic distribution | Inlet/outlet flushing; 2–5 mg/L ClO₂ shock for biofilm control; redistribution valve check | Quarterly | HLR within ±10% of design 6–60 cm/d |
| 2. Plant management | Phragmites/Typha harvest 1–2×/yr; invasive species removal; dormancy-season flow hold | 1–2× annual | Standing biomass 1.5–3.0 kg/m² |
| 3. Substrate and media | Sand/gravel rebed after 8–12 yr; fines accumulation logging | Annual inspection; full rebed 8–12 yr | Porosity ≥35% |
| 4. Dosing and polishing | 0.5–1.5 mg/L ClO₂ or 2–4 mg/L alum for phosphorus polishing | Seasonal / event-driven | Effluent TP <0.5 mg/L |
| 5. Monitoring | Inline pH, DO, conductivity, TSS; lab BOD/COD/NH3 monthly | Continuous + monthly grab | >90% data capture |
| 6. Seasonal adjustments | Cold-season HLR reduction 20–40%; FWS mosquito vector control | Quarterly | Compliant effluent year-round |
| 7. Restorative | Rotivation, air injection, partial rebed for failed beds | Event-driven (typically 5–10 yr cycle) | Hydraulic recovery to ≥80% of design |
Operators using an on-site chlorine dioxide generator for Pillar 4 dosing should size the unit for peak polish flow plus a 2× turndown for biofilm shock events, since Pillar 1 and Pillar 4 routinely share the same feed.
Clogging Diagnosis and Remediation: A Decision Framework
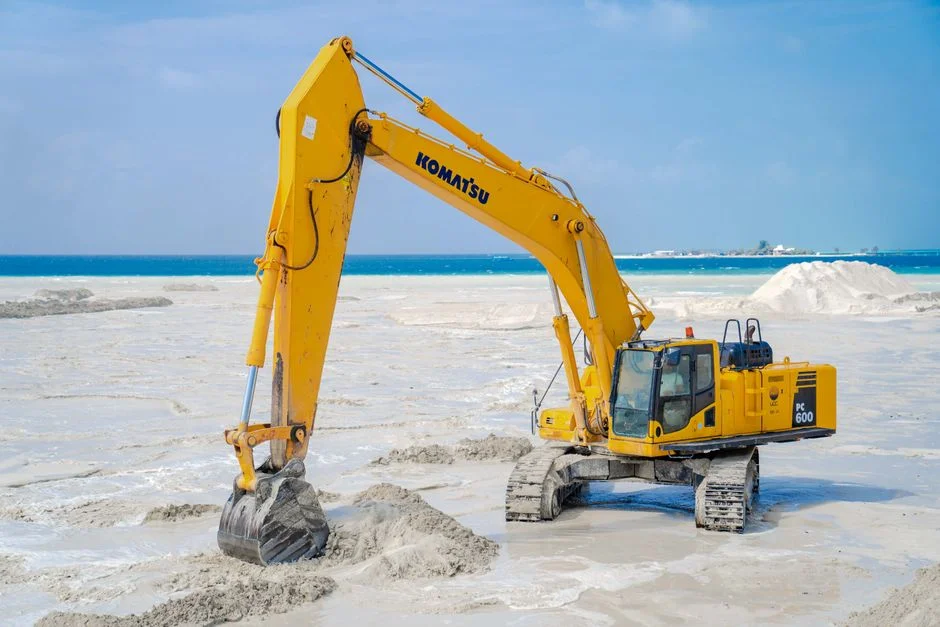
Three clogging modes account for roughly 90% of bed failures: surface ponding (visible standing water >24 h after dosing), subsurface short-circuiting (tracer appears at outlet <30% of theoretical retention time), and media compaction (bed surface drops >5 cm or piezometer differential >150 mm across a 30 m cell). The diagnostic flow is: visual surface inspection first, then a tracer-dye test (rhodamine WT or food-grade dye at 0.5–1.0 mg/L) to map short-circuits, then a pressure differential walk across the bed to localize fines accumulation. Match remediation to cause, because each fix has a different cost band: rotivation of the top 10–15 cm runs $0.50–$2/m², air-injection pump cycles for subsurface fines run $3–$8/m², and a full rebed sits at $25–$60/m² including media and downtime (HydropureWater field data, 2026). Early intervention typically pays—a single rotivation event typically defers a full rebed by 3–5 years on a VF bed receiving municipal secondary effluent. Sites feeding the wetland with a dissolved air flotation system upstream consistently report clogging intervals 2–3× longer than those without primary clarification, because TSS loading to the bed drops from 30–60 mg/L to <10 mg/L.
2026 OPEX Benchmarks by Wetland Type
OPEX for a maintained CW runs $0.05–$0.40 per m²·yr depending on configuration, with the dominant cost line shifting by type. The table below reflects 2026 field data from municipal and industrial operators in temperate climates; arid-zone and tropical sites should adjust labor and water-loss lines by ±20%.
| Wetland Type | OPEX Range (USD/m²·yr) | Dominant Cost Line | Typical Reactive Restoration Add-on |
|---|---|---|---|
| SSF (subsurface flow) | $0.10 – $0.40 | Labor (quarterly inspections, valve work) | $0.30 – $0.80 in a single clogging event |
| FWS (free water surface) | $0.05 – $0.20 | Plant harvest + vector control | $0.20 – $0.50 for sediment dredging |
| VF (vertical flow) | $0.15 – $0.35 | Chemical dosing + rest-cycle labor | $0.40 – $0.80 for top-layer rebed |
| Hybrid (SSF + VF or VF + FWS) | $0.20 – $0.50 | Combined: instrumentation + dosing | $0.50 – $1.00 worst-case |
Sodium-based sorbents (sodium-bentonite, modified zeolite) are pushing substrate-line costs down by 10–15% on new builds, while smart DO and ammonia probes are shifting OPEX distribution toward instrumentation—typically $400–$900 per probe with a 3–5 year calibration cycle. Operators benchmarking against an MBBR maintenance cost benchmark for 2026 will note that a well-maintained CW runs 30–60% cheaper per m³ treated than an equivalent moving-bed reactor, but loses that advantage quickly once reactive restoration enters the column.
12-Month Maintenance Calendar
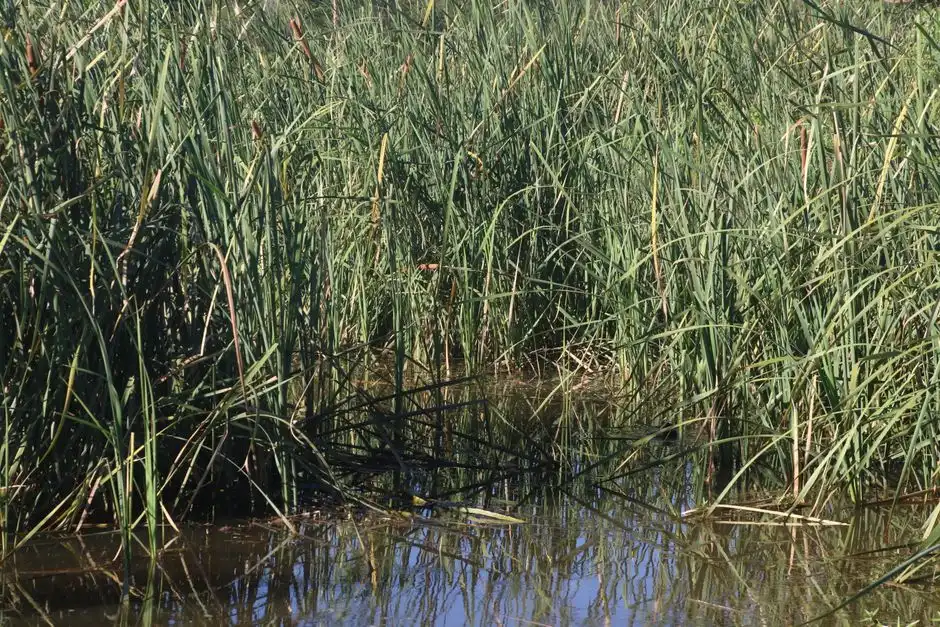
Effective maintenance requires translating the seven pillars into a quarterly cadence aligned with PLC/SCADA sampling triggers. Q1 (winter → spring): post-thaw visual inspection of all cells, distribution flushing, first plant growth check, and verification of inlet temperature >4 °C before resuming full hydraulic loading. Q2 (spring → early summer): full tracer test on one representative cell, distribution valve calibration, and a mosquito larvae dip-test on FWS cells (threshold: >5 larvae per dip in standing water). Q3 (summer): first plant biomass cut on SSF/VF beds, peak-load monitoring, and ClO₂ polish start if NH3 trends above 5 mg/L in cell effluent. Q4 (autumn): senescence cut, end-of-season tracer to confirm retention, pre-winter cover checks, and full instrumentation calibration including DO probe membrane replacement. Sites with hybrid configurations should integrate the calendar with PLC control for industrial wastewater plants so that each scheduled task generates a SCADA event with a timestamp and operator sign-off—this audit trail pays for itself the first time a regulator asks for proof of maintenance.
Integrating Constructed Wetlands with Downstream Treatment
The configuration of upstream and downstream unit operations determines both media life and downstream chemical demand. When the CW sits as a primary or secondary stage feeding mechanical polishing—typically an MBR membrane bioreactor, DAF, or ClO₂ disinfection skid—the upstream MBR effluent quality sets the fouling rate on the wetland media: cells receiving MBR permeate with TSS <5 mg/L run 2–3× longer between rebeds than cells fed raw secondary clarifier overflow at 20–30 mg/L TSS. On the downstream side, CW effluent that already meets <200 CFU/100 mL fecal coliform allows a 30–50% reduction in ClO₂ demand at the disinfection skid, because most of the oxidant demand has been satisfied by the wetland's biological pathway. For industrial loops with high TSS or oil-and-grease loading, a dissolved air flotation system as pre-treatment is the single most effective lever for extending CW service intervals, and should be specified before the wetland rather than retrofitted after the first clogging event.
Frequently Asked Questions
How often should a constructed wetland be inspected? Quarterly inspections are the cost-effective baseline for SSF, VF, and hybrid systems; FWS beds in temperate climates can drop to twice-yearly if mosquito-vector monitoring is automated. Each inspection should log HLR, surface condition, and outlet TSS, with data captured at >90% rate for trend analysis (HydropureWater field data, 2026).
What is the typical lifespan of wetland media before rebedding? Sand and gravel media in SSF and VF beds typically requires partial or full rebedding after 8–12 years of continuous operation, depending on influent TSS and dosing regime. Upstream MBR or DAF polishing can extend this to 15+ years by keeping accumulated fines below 5% of media volume.
How much does it cost to restore a clogged constructed wetland? Rotivation of the top 10–15 cm runs $0.50–$2/m² and is the most common early intervention; air-injection pump cycles for subsurface fines run $3–$8/m². A full rebed—the last resort—runs $25–$60/m² including media and downtime, making early diagnosis the single largest cost lever.
Do constructed wetlands need chemical dosing? For polishing to TP <0.5 mg/L or ammonia polishing above 5 mg/L, 0.5–1.5 mg/L ClO₂ or 2–4 mg/L alum is typical. Without dosing, CWs reliably deliver BOD/TSS removal but rarely meet tightening 2026 nutrient permits on industrial or high-strength municipal loads.
Can a constructed wetland operate through winter? Yes, but expect a 20–40% reduction in hydraulic loading rate below 4 °C and reduced nitrification efficiency. FWS beds freeze at the surface in cold climates; SSF and VF designs maintain treatment through winter with insulated covers and reduced flow.