Why Phenol Is a Top-Priority Continuous Monitoring Parameter
Phenol (C₆H₅OH) and its cresol/xylenol homologues are among the most stringently regulated parameters in industrial discharge because they are toxic to aquatic life at sub-mg/L concentrations, persist through biological treatment, and form chlorinated byproducts during final disinfection. China GB 8978-1996 sets a volatile phenol limit of 0.3 mg/L for second-class discharge and 0.5 mg/L for total phenols, both of which fall below the working range of most legacy laboratory methods run on a 24-hour composite. The EU Industrial Emissions Directive 2010/75/EU applies BAT-AEL ranges for total phenols that often drop below 0.5 mg/L at the coking and petrochemical waste stream exit (per EU IED 2010/75, 2024 BAT conclusions). In the United States, EPA categorical standards at 40 CFR Part 414 (organic chemicals, plastics, and synthetic fibers) impose daily maximum phenol limits as low as 0.04 mg/L for specific subcategories — well below what grab-sample routines can reliably document.
Typical industrial sources generating these streams include coking (gas liquor from coal carbonization carries 1,000–8,000 mg/L phenol before treatment), coal tar distillation, phenolic resin manufacture (resin plant washwater), oil refinery desalter effluent, pesticide and pharmaceutical synthesis, and carbon fiber precursor lines. Because phenol loads swing with batch operations and storm events, a 24-hour composite often misses the peak that triggers a non-compliance event. Continuous online monitoring is the only practical way to close that gap and to provide the data trail that regulators increasingly demand.
How Online Phenol Analyzers Work: The Four Measurement Methods
Engineers specifying an online phenol analyzer for wastewater will encounter four measurement chemistries in vendor quotes. Each has a distinct detection principle, interference profile, and total cost of ownership. The 4-aminoantipyrine (4-AAP) colorimetric method is the workhorse of the industry: phenol reacts with 4-AAP under alkaline conditions in the presence of an oxidant (typically potassium ferricyanide), and the antipyrine dye product is measured at 505–510 nm. It is selective for phenolic compounds with a free para-position, has a working range of roughly 0.01–10 mg/L, and is the reference method cited in most regulatory texts. Its weakness is interference from reducing agents, sulfide, and turbidity, which is why sample conditioning is non-negotiable.
UV-visible spectroscopy measures direct absorbance of the aromatic ring at 269–270 nm. Single-parameter UV phenol units are uncommon; instead, the analyzer is usually a multi-parameter platform like the HORIBA UV500, which uses a 2048-pixel spectrograph scanning 180–750 nm to derive phenol, COD, BOD, TOC, nitrate, colour, and phosphate from one sample stream (per HORIBA UV500 product specification, 2026). The advantage is parameter density; the disadvantage is that UV absorbance at 270 nm is not specific to phenol — other aromatics, surfactants, and humic substances contribute. UV-visible is the default for plants that need a single analyzer to cover multiple compliance parameters.
Gas chromatography with FID or ECD delivers the lowest detection limits (sub-µg/L) and the highest specificity, but it is not a true online method: cycle times of 30–60 minutes, carrier gas handling, and the skill required for column maintenance place GC outside continuous process monitoring. It is included here as the laboratory confirmatory method that engineers should retain for QA/QC of any continuous unit. Amperometric/electrochemical analyzers use direct oxidation of phenol at a working electrode (or an enzyme-based biosensor such as tyrosinase) to produce a current proportional to concentration. Response is sub-minute, reagent use is minimal, but long-term stability suffers in fouling-prone effluents with oils and high suspended solids.
| Method | Detection principle | Typical detection range | Response time | Why engineers select it |
|---|---|---|---|---|
| 4-AAP colorimetric | Antipyrine dye, 505–510 nm absorbance | 0.01–10 mg/L | 5–15 min cycle | Regulatory reference method; lowest detection at sub-mg/L |
| UV-visible spectroscopy | 269–270 nm direct absorbance, multi-wavelength spectrograph | 0.1–50 mg/L phenol | 1–5 min | Multi-parameter compliance (COD, BOD, TOC, NO3) from one unit |
| GC-FID/ECD (lab) | Chromatographic separation, flame ionization or electron capture | sub-µg/L | 30–60 min per injection | Reference and dispute resolution; not continuous |
| Amperometric/electrochemical | Direct oxidation current at working electrode | 0.05–5 mg/L | sub-minute | Low reagent, fast response; suited to clean streams |
2026 Spec Sheet Comparison: Detection Range, Response Time, Reagent Use
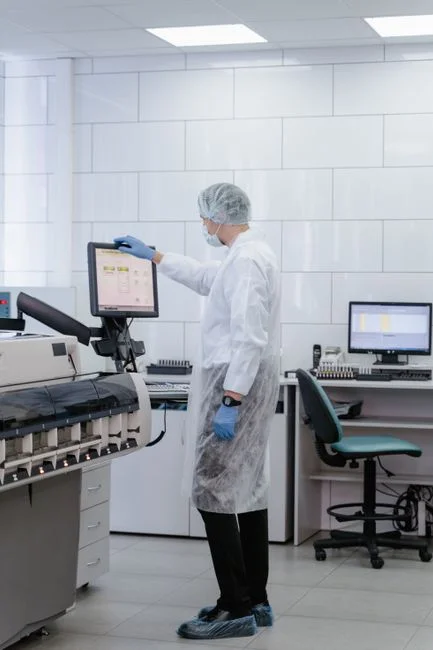
The reference table below consolidates 2026 vendor specifications into a format an engineer can paste into an internal evaluation matrix. Colorimetric 4-AAP units such as those built around the panel-mount form factor typically run a 0.05–5 mg/L working range with a 5–15 minute analytical cycle. Reagent consumption is the dominant operating cost: 0.5–2 L/week of prepared 4-AAP/ferricyanide buffer depending on cycle frequency. UV-visible multi-parameter analyzers (HORIBA UV500 class) extend the phenol range to 0.1–50 mg/L with 1–5 minute response; reagents are required only if PO4 or NH3 modules are enabled on the same platform. Amperometric sensors deliver the fastest response (sub-minute) and the lowest reagent draw, but require electrode replacement on roughly a monthly cycle. The 2-wire dual-channel transmitter architecture exemplified by the Yokogawa FLXA21 supports two sensor types on a single cable pair, which simplifies panel layout when phenol and pH/conductivity are co-located.
| Parameter | 4-AAP colorimetric | UV-visible multi-parameter | Amperometric | GC-FID (lab reference) |
|---|---|---|---|---|
| Detection range | 0.01–10 mg/L | 0.1–50 mg/L | 0.05–5 mg/L | sub-µg/L |
| Response / cycle time | 5–15 min | 1–5 min | Sub-minute | 30–60 min/injection |
| Reagent demand | 0.5–2 L/week | Only if NH3/PO4 modules enabled | Minimal; electrolyte only | Carrier gas, solvents |
| Maintenance interval | Weekly to monthly | Weekly to monthly (auto-clean) | Monthly electrode replacement | Quarterly column/service |
| CAPEX band (2026) | $8,000–$25,000 | $40,000–$75,000 | $10,000–$20,000 | $25,000–$60,000 (bench GC) |
| Form factor reference | Panel-mount single-parameter | HORIBA UV500 class | Insertion or flow-cell probe | Yokogawa FLXA21 (transmitter) |
CAPEX, OPEX, and Lifecycle Cost in 2026
A single-parameter 4-AAP colorimetric analyzer in a panel-mount configuration carries CAPEX of $8,000–$15,000 in 2026; the same analyzer in a weatherproof enclosure with full sample conditioning (filtration, cooling, pressure regulation) runs $15,000–$25,000. Multi-parameter UV-visible platforms such as the HORIBA UV500 class are $40,000–$75,000, and the premium is justified only when the same unit is delivering COD, BOD, TOC, nitrate, and phenol to the SCADA from one location. Amperometric systems sit in the $10,000–$20,000 band, and bench GC for laboratory confirmation runs $25,000–$60,000 depending on autosampler configuration.
OPEX scales with reagent consumption and labor. A 4-AAP colorimetric unit typically costs $1,200–$3,500/year in reagents, $400–$800/year in certified calibration standards, and $600–$1,200/year in consumable parts (peristaltic pump tubing, valve diaphragms, lamp replacements for UV units). Technician time averages 0.25–0.5 hr/day for visual checks, solution refills, and calibration verification. Service life is 8–12 years for colorimetric and UV-visible analyzers with proper maintenance; amperometric electrodes typically need replacement every 6–12 months. Against a baseline of grab sampling plus third-party lab analysis (often $80–$200 per sample at 2–4 samples/day), a continuous online unit reaches ROI within 2–5 grab-sample cost cycles, usually inside 18 months for a plant currently running daily composites.
Integration with Plant DCS, SCADA, and Sample Conditioning
The most common cause of analyzer project delay is under-specifying the signal output and the sample conditioning panel. Specify outputs at purchase: most modern units support 4–20 mA analog (one channel per parameter), Modbus RTU/TCP, PROFIBUS DP/PA, and HART 7 for handheld diagnostics. The Yokogawa FLXA21 2-wire dual-channel architecture is a useful reference for transmitter design: two sensor types (e.g., pH and conductivity, or conductivity and dissolved oxygen) on a single cable pair reduces conduit run and panel space, and the same pattern can be applied to phenol-plus-turbidity co-location.
Sample conditioning is where field experience separates a working installation from a year of troubleshooting. Standard requirements are: filtration to <100 µm (Y-strainer or auto-backflush); cooling if influent exceeds 40 °C (coking gas liquor often arrives at 55–70 °C); pressure regulation to 0.5–2 bar via a sample pressure reducing valve; and a fast-loop bypass with a take-off tee to reduce transport lag from minutes to seconds. Analyzer placement within 10 m of the sample tap minimizes lag and biofilm fouling. An automatic chemical dosing system for reagent feed is worth specifying for any plant that does not have a dedicated analyzer shelter with operator coverage; it handles buffer/oxidant replenishment and standard-addition calibrations on a schedule rather than relying on shift hand-offs. UV-visible platforms such as the HORIBA UV500 include automatic cleaning systems that drop manual maintenance to weekly or monthly intervals, a tangible OPEX benefit when the analyzer is in a remote or unstaffed location.
Selection Framework: Matching Analyzer to Influent and Discharge Destination
The decision rule for an online phenol analyzer for wastewater is driven by the discharge limit, the influent concentration range, the number of compliance parameters co-located at one sample point, and the fouling character of the stream. Four rules cover most procurements:
- Discharge limit <0.5 mg/L, influent 1–50 mg/L: 4-AAP colorimetric is the default. It is the regulatory reference method, has the lowest detection limit, and the broadest installed base. Pair with a GC reference method run quarterly for QA/QC.
- Multiple compliance parameters from one analyzer (phenol + COD + nitrate + turbidity): a multi-parameter UV-visible platform (HORIBA UV500 class) is justified when the same unit can replace two or three single-parameter analyzers at a small works or remote outfall.
- Heavy oils, tars, or high TSS in the influent: UV-visible with auto-clean, or amperometric with a robust membrane, outperforms colorimetric optics that will foul within days. Plan for monthly electrode or lamp service.
- Periodic compliance only, no real-time control: GC remains the gold standard for accuracy; pair it with a lower-cost continuous unit (colorimetric or UV) for trending between GC runs.
The underlying logic is: number of compliance parameters × number of sampling points vs. CAPEX budget. When the ratio is high (many parameters, few points), invest in multi-parameter UV-visible. When the ratio is low (one parameter, many points), standardise on panel-mount 4-AAP colorimetric and save the UV-visible CAPEX for sites that genuinely need it. For plants planning upstream Fenton oxidation for phenol-bearing wastewater, the analyzer should be placed after the Fenton reactor to verify destruction efficiency, not just at the final outfall. For broader IoT sensor integration for industrial wastewater plants, the same Modbus TCP backbone that carries phenol data can carry flow, pH, and ORP from upstream and downstream points without additional infrastructure.
Frequently Asked Questions

What detection limit is required to comply with China GB 8978?
An analyzer with a detection limit of at least 0.1 mg/L is required to reliably verify compliance against the 0.3 mg/L volatile phenol limit; 4-AAP colorimetric at 0.01–10 mg/L easily covers this range.
Can one analyzer measure both phenol and COD?
Yes. Multi-parameter UV-visible platforms (HORIBA UV500 class) derive COD and phenol from the same 180–750 nm spectrum, with the caveat that UV-derived COD and a true phenol-specific number are not interchangeable for regulatory reporting without correlation work.
How often does an online phenol analyzer need recalibration?
Typical 4-AAP units auto-calibrate every 24–72 hours with a phenol standard solution. UV-visible units verify against internal references on the same cycle; amperometric sensors usually need a 2-point calibration weekly.
What sample preparation is required?
Standard conditioning includes filtration to <100 µm, cooling if influent >40 °C, pressure regulation to 0.5–2 bar, and a fast-loop bypass. Analyzer placement within 10 m of the sample tap is recommended.
Is online monitoring accepted by Chinese and EPA regulators in place of grab sampling?
Yes, with proper QA/QC documentation. As of 2026 guidance, continuous online data with audit-trailed calibrations is accepted by both Chinese provincial environmental bureaus and US EPA regional offices, provided the analyzer is operated to method-equivalent standards and a reference GC confirmation is run at a defined frequency.