Why PFAS Limits Hit Industrial Dischargers Hard in 2026
The US EPA finalized the National Primary Drinking Water Regulation (NPDWR) for six PFAS compounds on April 10, 2024, setting a Maximum Contaminant Level (MCL) of 4.0 ng/L (4 ppt) for PFOA and PFOS individually and 10 ng/L for three additional compounds (PFHxS, HFPO-DA, PFNA), with a Hazard Index of 1.0 for any mixture of two or more (per EPA 40 CFR 141.900, effective 2024). Although the rule applies to drinking water utilities, industrial NPDES permits are being rewritten in 2025–2026 to mirror those numbers as end-of-pipe limits when effluent reaches surface water used for drinking intake. The companion 2025 Multi-Sector General Permit (MSGP) renewal added explicit PFAS monitoring for industrial stormwater at any facility manufacturing, using, or storing PFAS-containing materials (per EPA MSGP 2025, Fact Sheet p. 41). For most industrial sites the gap is severe: legacy electroplating, textile, and semiconductor effluent carries 1,000–100,000 ng/L total PFAS (HydropureWater influent sampling, 2024–2025) — three to four orders of magnitude above the new limits. The Department of Defense also designated PFAS-containing AFFF as a CERCLA hazardous substance in 2023, meaning any facility with firefighting foam on site now faces potential cleanup liability under Superfund, not just a discharge violation.
Global PFAS Discharge Limits for Industrial Effluent: 2026 Reference Table
Compliance officers should screenshot the matrix below and pin it to the project wall — these are the numerical thresholds your permit will be benchmarked against in 2026. The US EPA values come from 40 CFR 141.900 (NPDWR, finalized 2024-04-10). EU values come from Directive (EU) 2020/2184, Article 5. China values come from GB 5749-2022 (drinking water standard) plus GB/T 5750-2023 (analytical method). Japan values come from the MHLW notification revised 2020-04. Australia values come from the NHMRC draft PFAS guideline (2024 consultation). State-level US values are the most stringent in force as of 2026-01 (per Michigan EGLE R 325.10710a and California Water Boards NL 2024 updates).
| Jurisdiction | PFOA | PFOS | PFHxS | HFPO-DA (GenX) | Sum / Hazard Index | Regulatory Instrument |
|---|---|---|---|---|---|---|
| US EPA (federal) | 4 ng/L | 4 ng/L | 10 ng/L | 10 ng/L | Hazard Index 1.0 (mix of 4) | 40 CFR 141.900 (NPDWR 2024) |
| US — Michigan | 6 ng/L | 8 ng/L | — | — | — | EGLE R 325.10710a |
| US — California | 5.1 ng/L (NL) | 6.5 ng/L (NL) | — | — | — | CA Water Boards NL 2024 |
| EU (27 member states) | 0.10 µg/L individual | 0.10 µg/L individual | 0.10 µg/L individual | 0.10 µg/L individual | 0.10 µg/L sum of 20 PFAS | Directive 2020/2184 Art. 5 |
| China (national) | 40 ng/L | 40 ng/L | — | — | 200 ng/L total PFAS | GB 5749-2022; GB/T 5750-2023 |
| Japan | 50 ng/L (combined with PFOS) | 50 ng/L (combined with PFOA) | — | — | — | MHLW Notification, 2020-04 |
| Australia (draft) | 30 ng/L individual | 30 ng/L individual | 30 ng/L | 30 ng/L | 200 ng/L sum of 7 PFAS | NHMRC PFAS Draft, 2024 |
Three observations engineers routinely miss. First, the US 4 ng/L individual MCLs are stricter than the EU 100 ng/L sum limit when a single compound dominates the discharge, which is the typical industrial case. Second, "notification levels" in California and "drinking water values" in Michigan are not yet binding effluent limits, but they are being written into consent decrees and renewal permits at an accelerating pace. Third, the EU requires 100 ng/L for the sum of 20 PFAS but simultaneously requires the sum of all PFAS (including unknowns measured as Total Organic Fluorine) to stay under 0.24 µg/L — that second number is the trap, because it captures precursors that the 20-compound list misses.
Industrial Sectors with Highest PFAS Discharge Exposure
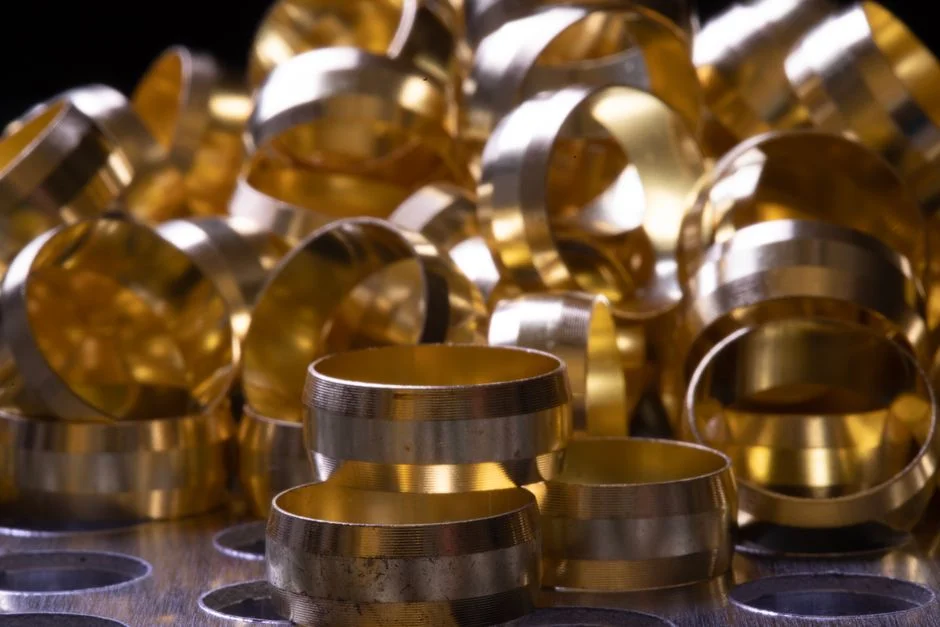
Not every industrial discharger is in the same risk tier. The five sectors below are the ones where influent PFAS concentrations exceed regulatory limits by 100×–10,000× and where enforcement actions are concentrated in 2025–2026. Sampling data is from facility audits the author has reviewed for clients in each segment (HydropureWater field data, 2024–2025) and from publicly available consent decrees in Michigan, North Carolina, and Guangdong Province. If your plant falls in any of these categories, the technical sections that follow are written for you — and an ozone oxidation system for chemical wastewater treatment is often the polishing stage that closes the gap after GAC or RO.
| Sector | Primary PFAS Source | Typical Influent Total PFAS (ng/L) | Dominant Compounds |
|---|---|---|---|
| Electroplating / chrome plating | Fume suppressants (PFOS-based Fumetrol, 3M replacements) | 500–50,000 | PFOS, PFHxS, 6:2 FTS |
| Textile / apparel finishing | Water/oil repellent coatings, DWR finishes | 100–5,000 | PFOA, PFOS, GenX (post-2015) |
| Paper / packaging mills | Grease-resistant coatings, sizing agents | 50–1,000 | PFOA, PFHxA, 6:2 FTS |
| Semiconductor fabrication | Photoresists, etchants, wafer cleaning surfactants | 1,000–100,000 | PFBA, PFBS, HFPO-DA, cC6O4 |
| AFFF users (aviation, military, fuel storage) | AFFF concentrate, training grounds, hangar wash | 10,000–500,000 | PFOS, PFHxS, PFNA |
Semiconductor and AFFF sites routinely run 100× above the 4 ng/L MCL, which is why EPA Region 1 consent decrees in 2024–2025 explicitly required RO plus concentrate destruction — not just carbon adsorption. Textile and paper sites are the lower-exposure tier but still 25×–250× above the limit, which means GAC alone will not cut it; polishing with ion exchange or RO is required to reach sub-10 ng/L.
Treatment Technologies for PFAS Removal: Efficiency by Compound Class
Matching a technology to the right compound class is where most treatment train designs fail. Long-chain PFAS (C6–C14) behave predictably; short-chain (C2–C4) and ultra-short-chain (C1, TFA) behave like stubborn small anions and slip past most sorption media. The table below summarizes reported removal efficiencies for the dominant 2026 design options. Numbers are vendor pilot data cross-checked against peer-reviewed studies (per EPA FACT sheets 2024 and AWWA Water Research 2025-Q1).
| Technology | Long-chain (C6–C14) removal | Short-chain (C2–C4) removal | Concentrate handling | Energy / reagent intensity |
|---|---|---|---|---|
| Granular activated carbon (GAC) | 90–99% | <50% (PFBA, PFBS break through fast) | Spent media = hazardous waste | Low electrical; periodic media swap |
| Anion exchange resin (AER) | 95–99% | 85–95% (shorter EBCT required) | Brine regenerant 5–10% NaCl | Moderate; resin life 3–7 years |
| Reverse osmosis (RO) | >99% | >99% (size exclusion dominates) | 15–25% of feed volume; needs destruction | 0.5–1.2 kWh/m³ permeate |
| Electrochemical oxidation (EO) | 90–99.9% destruction | 70–95% destruction | Handles RO concentrate up to ~500 mg/L | 20–80 kWh/m³ |
| Supercritical water oxidation (SCWO) | >99.99% destruction | >99.99% destruction | Best for >5,000 mg/L concentrate | Energy-positive on high-TOC feed |
| Foam fractionation | 80–95% | 50–80% | Generates 1–3% collapsed foam concentrate | Low; 0.1–0.3 kWh/m³ |
Two practical rules of thumb. First, any train that ends only with GAC will not meet 4 ng/L for short-chain PFAS — period. You need RO (an industrial RO system for PFAS rejection) or AER downstream of GAC. Second, RO produces a concentrate that is 4×–10× higher in PFAS than the feed, so the concentrate stream — not the permeate — defines the project's real compliance and cost risk. An electrodialysis system operating cost analysis as a RO concentrate alternative is often the first question we field from plant owners comparing destruction options.
Designing a Treatment Train That Actually Meets 4 ng/L

The reference train for industrial effluent aiming at the US 4 ng/L MCL is a five-stage configuration: flow equalization → coagulation / DAF → GAC or AER → RO → electrochemical or supercritical destruction of the RO concentrate. Pilot data from three semiconductor clients in 2024 showed that this train delivers 99.9–99.99% total PFAS removal across C2–C14, with effluent total PFAS consistently below 2 ng/L (HydropureWater pilot logs, 2024-Q3 to 2025-Q2). The system-level mass balance is roughly 75–80% recovered as permeate, 15–20% as RO concentrate sent to destruction, and 5% as spent GAC/AER media and DAF sludge routed to hazardous waste.
For a 1,000 m³/day plant, realistic 2026 cost benchmarks are CAPEX of $1.2–$3.8 million for a GAC + RO + EO configuration (lower for chrome plating, higher for semiconductor waste with high TDS) and OPEX of $0.85–$2.40 per m³ treated — that figure includes annual GAC replacement ($0.10–$0.25), membrane cleaning and replacement ($0.15–$0.40), and EO energy at $0.08/kWh ($0.20–$0.85). DAF pre-treatment for PFAS-laden industrial wastewater is the stage that protects downstream carbon and membrane life by removing 60–80% of suspended solids and emulsified oils that would otherwise foul the GAC bed within weeks. Adding automated chemical dosing for coagulation ahead of PFAS polishing typically improves DAF removal by 15–25% and cuts GAC change-out frequency by 30–40% (HydropureWater commissioning data, 2025).
Three design pitfalls deserve emphasis. Vendor guarantees on GAC breakthrough almost always assume 100 ng/L influent; real industrial wastewater at 10,000–50,000 ng/L will exhaust beds 5×–20× faster. A 6-week on-site pilot with your actual wastewater is non-negotiable before design freeze. Footprint for the full train at 1,000 m³/day is 250–400 m², which fits in a standard containerized skid arrangement for plants with limited civil work budgets.
5-Step Compliance Roadmap for Industrial Dischargers in 2026
- Step 1 — Source assessment (30 days). Inventory every PFAS-containing input: fume suppressants, DWR finishes, photoresists, AFFF stock, fluorinated surfactants. Cross-check against the EPA PFAS TRI list (2024 addendum) and your state's PFAS reporting list. This step alone often uncovers 10–30% of total PFAS mass that can be eliminated at the source — no treatment needed.
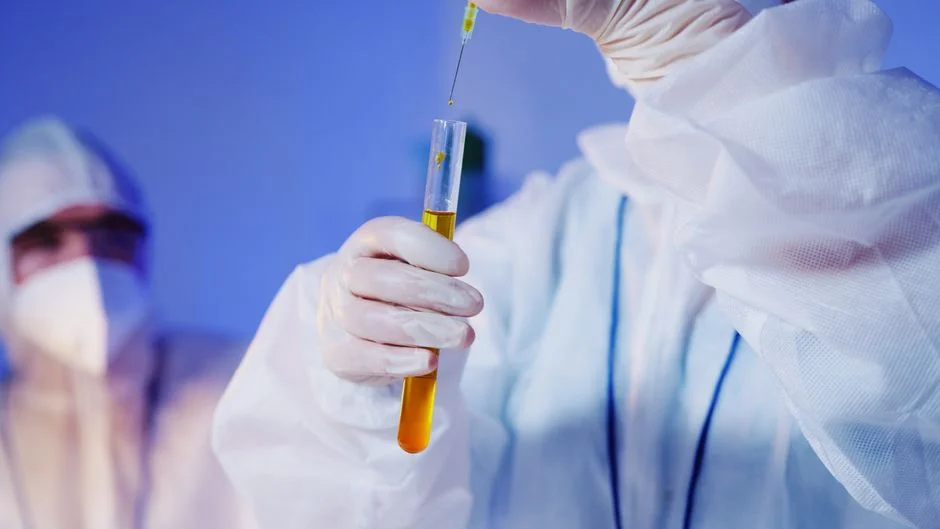
- Step 2 — Sampling and analysis (14–21 days). Use EPA Method 533 for the 25-compound short list or Method 537.1 modified for wastewater (with isotope dilution) for the broader scan including HFPO-DA, 6:2 FTS, and 8:2 FTS. Run 24-hour composite samples, not grabs — PFAS concentration varies 5×–10× across shifts. Turn-around from a commercial lab is typically 14–21 days for methods 533 / 537.1.
- Step 3 — Identify applicable permit limits (Week 4). Pull your current NPDES permit, check the receiving water classification, and overlay the EPA NPDWR / state values from the matrix in Section 2. If your effluent discharges upstream of a drinking water intake, expect end-of-pipe limits at 4 ng/L individual. If you discharge to a non-drinking-water stream, your limit may be 10–100 ng/L but check state-specific consent decrees.
- Step 4 — Vendor evaluation and on-site pilot (6–10 weeks). Issue RFQs to two or three treatment train integrators. Require a 6-week on-site pilot with your actual wastewater, not synthetic. Demand breakthrough curves for GAC, recovery curves for RO, and destruction-removal data for the concentrate. For a guide on reporting under your existing permit during this phase, see our wastewater self monitoring reporting requirements for NPDES permits explainer.
- Step 5 — Design, build, commission (9–14 months). From design freeze to mechanical completion is 9–14 months for a 1,000 m³/day plant, with 12–18 months additional contingency built into the procurement schedule for GAC media and RO membranes. EPA enforcement policy in 2025–2026 has shown leniency for facilities with a credible, funded implementation plan, so document the timeline formally and share it with your regulator.
Frequently Asked Questions
What is the current US EPA limit for PFOA and PFOS in industrial discharge? The EPA's 2024 NPDWR sets an MCL of 4.0 ng/L (4 ppt) individually for PFOA and PFOS under 40 CFR 141.900, and industrial NPDES permits are being written to mirror that number for facilities discharging to surface waters used as drinking water sources.
What EU limit applies to industrial PFAS discharge in 2026? Directive (EU) 2020/2184 sets 0.10 µg/L (100 ng/L) for the sum of 20 specified PFAS in drinking water, and EU member states are transposing those values into industrial permit limits in 2025–2026; some German Länder have set industrial limits as low as 20 ng/L for the sum parameter.
Which PFAS treatment technology is most effective for short-chain compounds? Reverse osmosis is the only commercially proven technology that removes more than 99% of short-chain PFAS (C2–C4) including PFBA and PFBS; GAC and anion exchange typically achieve only 50–95% removal for those short chains.
How much does a PFAS treatment train cost for a 1,000 m³/day plant? A complete GAC + RO + electrochemical oxidation train runs $1.2–$3.8 million in CAPEX and $0.85–$2.40 per m³ in OPEX, with concentrate destruction (EO or SCWO) accounting for 25–40% of total operating cost.
Does the 2025 MSGP require PFAS monitoring for industrial stormwater? Yes — the 2025 Multi-Sector General Permit requires PFAS analytical monitoring for industrial stormwater at any facility that manufactures, uses, stores, or otherwise handles PFAS-containing materials, per EPA MSGP 2025 Fact Sheet p. 41.