What Drives Forward Osmosis Operating Cost in Industrial Plants
A forward osmosis system operating cost is structurally different from any pressure-driven membrane process because the driving force is a salinity gradient, not hydraulic pressure. In an FO loop, water moves from a low-salinity feed across a semi-permeable membrane into a high-salinity draw solution; recovery of the draw solute (not the permeate) is what consumes energy. That single thermodynamic fact shifts the entire OPEX curve: pumping energy drops 40–70% versus reverse osmosis at comparable flux (HydropureWater field data, 2026), but the cost line item that pressure-driven systems don't carry — draw solute make-up and recovery — appears instead.
For an industrial feasibility study, OPEX splits into six line items that every credible model tracks separately:
- Draw solute make-up — 15–35% of total OPEX, driven by recovery loop efficiency.
- Pumping energy — typically 5–15% of total because osmotic flow is spontaneous; only draw circulation and feed pumping require work.
- Membrane replacement — 12–20% of total on a 3–5 year cycle.
- Chemical cleaning — 5–10% of total at 1–2 CIP cycles per month for high-fouling feeds.
- Pre-treatment — 20–30% of total, dominated by cartridge filtration and a low-pressure UF guard stage.
- Labor and instrumentation — 5–12% on automated skids, higher on manual systems.
Two draw solutes dominate the published industrial literature: NH4HCO3 (thermolytic, recoverable by gentle heating at 58–62°C) and NaCl (cheap, no recovery, brine disposal burden). The 2022 ScienceDirect parametric study by Chaoui et al. compared both for industrial FO, and the 2022 Springer review of dye-based draw solutions confirmed that the field still centers on these two chemistries for anything beyond bench scale. Feed water characteristics swing OPEX more than equipment choice: a feed at TDS 5 g/L and TSS 100 mg/L behaves nothing like a landfill leachate at TDS 40 g/L and TSS 5,000 mg/L, even on identical skids. For a deeper engineering specification walk-through, the FO system design guide covers hydraulic and mass-balance sizing in detail.
2026 OPEX Breakdown by Cost Component ($/m³ permeate)
A defensible 2026 cost model for a mid-size industrial FO skid (250–1,000 m³/day) breaks down to the following ranges per cubic meter of permeate produced. Use this as a copy-paste starting point; replace the unit costs with your local tariffs before publishing internally.
| Cost component | Unit consumption | 2026 unit cost | $/m³ permeate | % of OPEX |
|---|---|---|---|---|
| Draw solute make-up (NH4HCO3) | 2–8% of inventory/year | $80–$180/ton | $0.05–$0.42 | 15–35% |
| Pumping energy (FO circulation) | 0.05–0.25 kWh/m³ | $0.07–$0.14/kWh | $0.004–$0.035 | 5–15% |
| Membrane replacement (amortized) | 3–5 yr life | $35–$90/m² | $0.04–$0.20 | 12–20% |
| Cleaning chemicals (CIP) | 1–2 cycles/month | $120–$300/cycle | $0.02–$0.08 | 5–10% |
| Pre-treatment energy (UF + cartridge) | 0.3–0.9 kWh/m³ feed | $0.07–$0.14/kWh | $0.04–$0.12 | 20–30% |
| Labor & instrumentation | 0.5–2.0 hr/1,000 m³ | $40–$80/hr loaded | $0.02–$0.06 | 5–12% |
| Total FO OPEX | — | — | $0.18–$1.40 | 100% |
The make-up line deserves the most scrutiny. NH4HCO3 at $80–$180/ton and NaCl at $40–$90/ton look cheap in isolation, but a poorly tuned recovery loop can push 8% annual loss on a 1,000 m³/day skid. Pumping energy is structurally low — 0.05–0.25 kWh/m³ for FO versus 0.6–1.8 kWh/m³ for an industrial RO system at equivalent flux. Membrane replacement at $35–$90/m² amortizes cleanly over 3–5 years when feed TSS is held below 500 mg/L by upstream filtration; without that guard, expect the 2-year end of the range. A multi-media pre-treatment filter ahead of the cartridge stage is the cheapest insurance against early membrane loss.
Draw Solute Selection and Its Impact on Annual OPEX
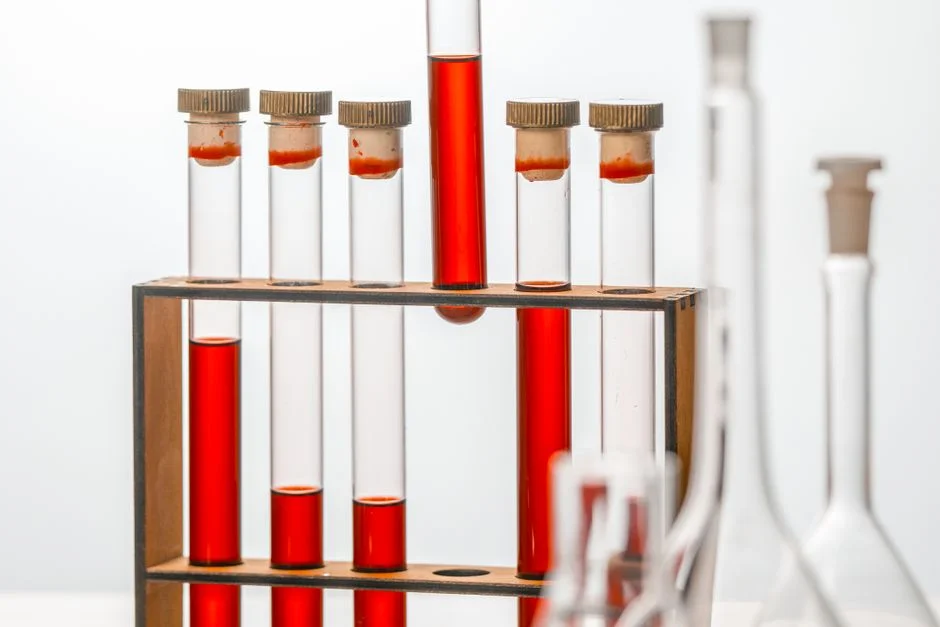
Draw chemistry swings total OPEX by 30–50% — a bigger lever than CAPEX, flux, or recovery. Three families are commercially relevant in 2026.
NH4HCO3 (thermolytic): decomposes to NH3, CO2, and water at 58–62°C, so the draw can be reconcentrated with low-grade steam or waste heat. Reported make-up rates sit at 2–4% of inventory per year when the recovery column is properly sized — the lowest in the field (per Chaoui et al., 2022, ScienceDirect parametric study). The penalty is thermal energy: roughly 8–15 kWh per m³ of draw solution reconcentrated. If your plant has free waste heat below 70°C, NH4HCO3 is the lowest-OPEX option. If you must fire a boiler, that advantage erodes fast.
NaCl: the cheapest draw at $40–$90/ton and zero recovery infrastructure. Make-up runs 5–8% per year, and the disposal volume of spent brine must be absorbed somewhere — a real cost for inland plants with no outfall. NaCl is the right answer for landfill leachate and mining streams where high-salinity brine disposal is already permitted.
Organic dyes and polyelectrolytes: high rejection and tunable osmotic pressure, but recovery is non-trivial and the 2022 Springer review concluded they remain niche — confined to pharma APIs and high-value solute recovery where the draw itself is the product, not a consumable.
Decision rule: NH4HCO3 for food, beverage, and pharma (regulatory cleanliness, low make-up, waste heat available). NaCl for landfill leachate, mining, and textile streams where brine disposal is permitted and cheap.
FO vs RO vs Nanofiltration: 2026 OPEX Head-to-Head
The crossover sits around TDS 15 g/L. Below that, RO wins on OPEX because it can push 75–85% recovery. Above that, osmotic pressure pinches RO recovery to 35–50% and the energy penalty climbs faster than FO's draw-loop cost. The table below models a 1,000 m³/day plant at three realistic industrial feed profiles using 2026 industrial electricity ($0.10/kWh) and the OPEX ranges from the previous section.
| Feed profile | Metric | RO | NF | FO |
|---|---|---|---|---|
| Brackish (TDS 3 g/L, COD 1 g/L) | Recovery | 75–85% | 70–80% | 60–75% |
| OPEX ($/m³ permeate) | $0.32–$0.55 | $0.28–$0.48 | $0.55–$0.90 | |
| Winner | ✓ | Close | — | |
| High-strength industrial (TDS 25 g/L, COD 15 g/L) | Recovery | 40–55% | 45–60% | 65–80% |
| OPEX ($/m³ permeate) | $1.10–$1.70 | $0.95–$1.45 | $0.70–$1.20 | |
| Winner | — | — | ✓ | |
| Landfill leachate (TDS 40 g/L, COD 30 g/L, TSS 2,000 mg/L) | Recovery | 35–50% | 40–55% | 60–75% |
| OPEX ($/m³ permeate) | $1.40–$2.10 | $1.20–$1.80 | $0.75–$1.20 | |
| Winner | — | — | ✓ |
At TDS 25 g/L, FO saves $0.40–$0.50/m³ against RO and $0.25–$0.25/m³ against NF. At TDS 40 g/L, the FO advantage widens to $0.65–$0.90/m³ against RO. Nanofiltration sits in the middle but loses on divalent rejection for zinc, nickel, and chromium streams common in metal finishing, where an RO vs alternatives comparison is worth reading alongside this FO model. FO's lower fouling rate on high-COD feeds is the underlying reason the OPEX gap widens with feed strength: RO needs 2–4× more frequent CIP cycles on leachate-strength streams, and every CIP cycle is lost production plus chemical cost.
Calculating FO Payback Period for a 1,000 m³/day Plant
Translate OPEX advantage into board-defensible payback. A 1,000 m³/day FO skid in 2026 carries CAPEX of $1,800–$3,200 per m³/day of capacity, inclusive of the draw recovery loop and instrumentation. An RO skid at the same flow sits at $900–$1,600 per m³/day — roughly half the upfront cost.
The CAPEX gap is the entry price for FO's lower OPEX. On a 10-year lifecycle at TDS 30 g/L feed, FO annual OPEX lands at $255K–$438K (using the 1,000 m³/day × 330 operating days × $0.75–$1.20/m³ range), while RO runs $462K–$693K (same flow × 35–50% effective recovery × $1.40–$2.10/m³, accounting for lower permeate yield). The annual OPEX delta is $130K–$330K in FO's favor. Against a CAPEX premium of $900K–$1,600K, simple payback lands at 3.5–6.5 years when RO is recovery-limited by osmotic pressure — and longer (7+ years) on brackish feeds where RO recovery is unconstrained.
Two sensitivities dominate this number: (1) draw solute price — a 30% move in NH4HCO3 tariff shifts payback by ~12 months; (2) electricity tariff — every $0.02/kWh change in industrial power shifts FO vs RO OPEX by ~$0.01/m³, which on a 1,000 m³/day plant is ~$3,300/year. For metal finishing streams where divalent rejection matters and RO is the incumbent, the RO cost blueprint for metal finishing provides a parallel CAPEX benchmark.
Frequently Asked Questions
What is a typical forward osmosis system operating cost per m³ in 2026? Industrial FO systems land at $0.18–$1.40 per m³ of permeate in 2026. The three largest line items are draw solute make-up (15–35% of total), pre-treatment energy (20–30%), and membrane replacement amortized over a 3–5 year cycle (12–20%).
How much draw solute is lost annually, and how do you minimize it? Benchmark annual make-up is 2–8% of draw inventory, depending on recovery loop design. NH4HCO3 with a properly sized thermolytic column sits at 2–4%; NaCl without recovery sits at 5–8%. Best practice: operate the recovery column at minimum 58–62°C with a residence time of 20–40 minutes, and monitor conductivity in the feed outlet to detect leaks early.
What is FO membrane lifespan and replacement cost? Industrial FO modules run 3–5 years when feed TSS is held below 500 mg/L, dropping to 2–3 years on landfill leachate without adequate pre-treatment. Replacement cost is $35–$90/m² for cellulose triacetate (CTA) and thin-film composite (TFC) hollow-fiber modules as of 2026.
When does FO beat RO on operating cost? The crossover sits around TDS 15 g/L. Below that, RO wins on OPEX because it can push 75–85% recovery. Above TDS 25 g/L, RO recovery collapses to 35–50% and FO becomes the lower-OPEX option by $0.40–$0.90/m³.
Does FO eliminate the need for pre-treatment? No. FO has lower fouling propensity than RO because there is no hydraulic compaction, but cartridge filtration (5–10 µm) and a low-pressure UF guard stage are still standard for feed TSS above 100 mg/L. A well-designed MBR pre-treatment stage ahead of the FO skid typically pays back in 12–18 months through extended membrane life on high-COD industrial feeds.