Why Decentralized Treatment Is a 2026 Procurement Priority
In 2026, decentralized wastewater treatment has moved from a niche engineering question to a board-level procurement decision. The 2017 Water Practice & Technology baseline on small-community decentralization (Vol. 12, No. 2, pp. 463–477) framed the conversation around rural clusters and small agglomerations under 2,000 PE. The 2026 picture is industrial: textile mills in inland China, food-processing plants in water-stressed Indian states, mining camps in the Australian outback, and resort/hospital micro-sites in the Gulf all require packaged or containerized treatment because municipal sewers are absent or capacity-constrained.
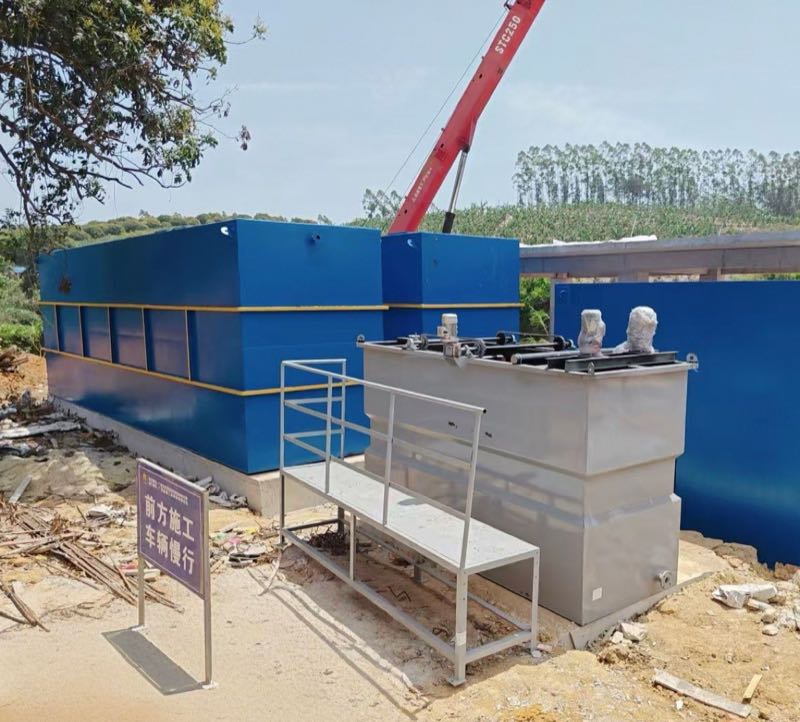
Three regulatory drivers explain the shift. The EU Urban Wastewater Treatment Directive 91/271/EEC continues to tighten small-agglomeration compliance, and the Industrial Emissions Directive 2010/75/EU sets effluent limits per sector. In the US, the EPA's 2024–2025 decentralized wastewater policy updates tightened reporting for systems under 1 MGD, while China's GB 18918-2002 Grade 1A remains the most-cited reuse benchmark across Asia. In 2026, "decentralized" no longer means a septic tank and a drainfield — it means a sub-5 MLD packaged wastewater treatment plant, typically containerized MBR or modular SBR/MBBR, designed to discharge to surface water, irrigation, or industrial reuse.
For procurement, the practical consequence is that the 2026 vendor pool is global, segmented by capacity and discharge target, and the cost gap between regional skid-builders and global EPC majors has narrowed enough to make a documented shortlist defensible to a CFO and a regulator at the same time.
Four Tiers of Decentralized WWTP Key Players in 2026
The 2026 decentralized market is best read as four competitive tiers, each with a distinct sweet spot in capacity, technology, and project delivery model.
Tier 1 — Global EPC majors. Veolia, Suez, and Xylem compete on municipal and large industrial decentralized projects from 0.5 to 50 MLD. Their 2026 pitch is turnkey EPC with embedded digital service contracts, and they clear PFAS, micropollutant, and reuse-grade compliance without a sub-supplier.
Tier 2 — Asian OEM specialists. Kubota (Japan), Hitachi, and Chinese OEMs such as the HydropureWater range and Hammon compete in the 1–2,000 m³/day containerized MBR and underground integrated unit segment. Chinese units typically run 30–50% below Western EPC turnkey on equivalent scope, with faster containerized delivery from Tianjin, Shanghai, and Guangzhou. Hitachi's larger packaged units and Kubota's JS / JK series dominate the Japanese hospital and resort micro-site market.
Tier 3 — North American packaged innovators. Orenco (residential onsite, decentralized since the 1980s), Fluence (containerized MBBR/MBR for emerging markets), Enereau (nrPUR MBR, land development/resorts/commercial, 32–135 m³/day per unit range), Biomicrobics, and regional distributors such as SCG Enterprises in Colorado (carrying Orenco, Mazzei, Atlantic UV, Xerxes, Geoflow) serve 1–500 m³/day commercial, residential, and resort projects with strong regulatory documentation. They are typically the lowest-friction path for a US Title 22 or Canadian site with a tight service radius.
Tier 4 — Regional skid-builders and EPC contractors. Local integrators win on sub-100 m³/day scope and fast delivery but have limited process depth, no membrane IP, and thin O&M support beyond the commissioning year. For buyers with stable, low-load influent they are the price leader; for variable or high-load industrial wastewater they are rarely the right shortlist member. Contaminants like PFAS now sit squarely inside this evaluation set, as detailed in the PFAS removal technology key players 2026 guide.
2026 OEM Comparison: Technology, Capacity, and Segment Fit
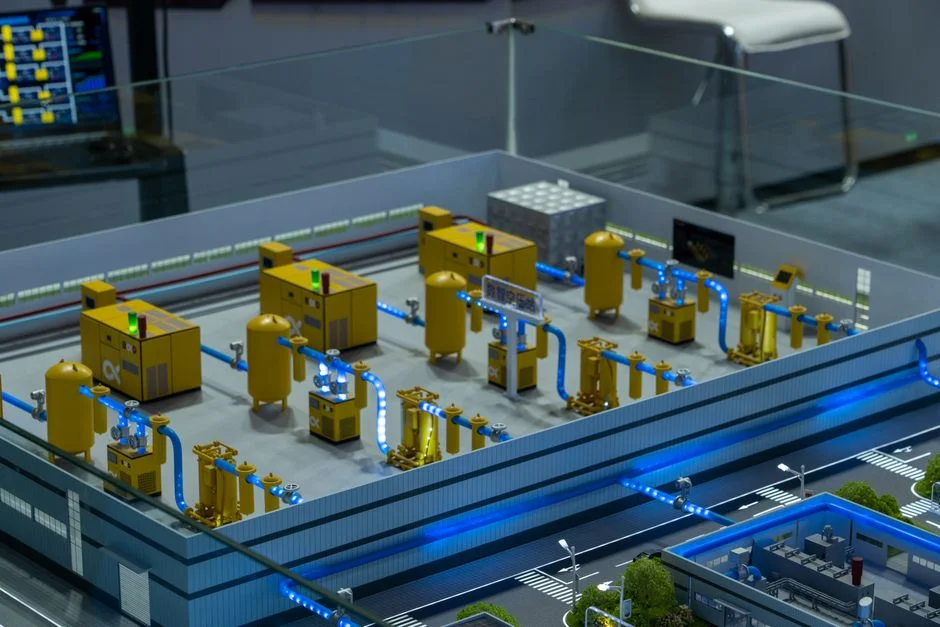
The matrix below maps the major 2026 decentralized wastewater treatment key players by core technology, capacity range, and industrial fit. Capacity figures are OEM-published 2026 ratings, and the regional column reflects delivered project base, not HQ country alone.
| OEM | HQ / Region | Core Technology | Capacity Range | Target Segment | Regional Coverage |
|---|---|---|---|---|---|
| Veolia | France / Global | MBR, SBR, activated sludge + reuse polish | 0.5–50 MLD | Municipal + large industrial decentralized | Worldwide, strong EU/MENA |
| Suez | France / Global | MBR, biofilm, DAF tertiary | 0.5–30 MLD | Municipal + F&B, pharma, chemicals | Worldwide, strong Americas |
| Xylem | USA / Global | Sanitaire MBR, Leopold UF, Wedeco UV | 0.2–20 MLD | Industrial + municipal decentralized | Worldwide |
| Kubota | Japan / APAC | Submerged membrane + contact oxidation | 10–5,000 m³/day | Residential blocks, hospitals, small municipal | APAC, growing MENA |
| Hitachi | Japan / APAC | MBR packaged, ion-exchange polish | 50–10,000 m³/day | Industrial reuse, semiconductor, hospital | APAC |
| HydropureWater | China / Global export | A/O contact oxidation (WSZ); PVDF MBR | 1–2,000 m³/day | Residential, hospital, factory, rural decentralized | Global export, strong Southeast Asia, Africa, MENA |
| Orenco | USA (Oregon) | AdvanTex textile media / packed-bed | 1–200 m³/day | Residential, resort, commercial onsite | North America |
| Fluence | USA / Brazil / Global | Containerized MBBR / MBR (NIROBOX) | 10–5,000 m³/day | Emerging-market municipal, mining, F&B | Worldwide |
| Enereau | Canada (Ontario) | nrPUR MBR (PVDF, DF flat sheet) | 32–135 m³/day per unit, modular | Land development, resorts, commercial | North America |
| Biomicrobics | USA (Kansas) | MBR / extended-aeration packaged | 1–500 m³/day | Residential, commercial, small industrial | North America |
For a typical industrial buyer at 50–500 m³/day, the practical shortlist is usually drawn from the middle three rows. The WSZ underground integrated sewage treatment plant covers 1–80 m³/h applications (residential, hospital, factory, rural) using A/O biological contact oxidation, while the HydropureWater MBR integrated wastewater treatment system scales from 10 to 2,000 m³/day, delivers effluent below 1 μm turbidity, and typically cuts civil footprint by around 60% versus a conventional basin layout.
Technology Selection: MBR vs SBR vs Constructed Wetland vs MBBR
Before buyers commit to an OEM brand, the process technology has to match the influent and the discharge destination. Four architectures dominate the 2026 decentralized market.
MBR (Membrane Bioreactor). The default choice when the effluent is targeted for reuse, when footprint is constrained, or when the regulator wants sub-1 μm TSS. PVDF submerged modules with 0.1 μm pore size are now standard. The HydropureWater MBR, Enereau nrPUR, and Kubota submerged-membrane units sit here. The trade-off is energy — coarse-bubble aeration for membrane scouring typically adds 0.3–0.6 kWh/m³ versus a conventional activated-sludge basin — and sensitivity to FOG and surfactant spikes. Flat-sheet DF modules, including the DF series MBR flat sheet membrane module, simplify cleaning and tolerate dry-out better than hollow-fiber, at the cost of slightly higher footprint per m² of membrane area. For a structured cost comparison against conventional activated sludge, the MBR vs conventional activated sludge 2026 cost breakdown walks through the OPEX delta line by line.
SBR / sequencing batch. Lower CAPEX, larger hydraulic footprint, and tolerant of variable influent — the workhorse at most US onsite vendors and at Chinese underground integrated plants like WSZ for sub-50 m³/day sites. Effluent quality is generally good but rarely reuse-grade without a downstream sand or UF polish.
Constructed wetland / soil-based systems. Lowest OPEX (essentially gravity-driven) and land-intensive, typically 5–10 m² per PE. Orenco's AdvanTex textile media fits this architectural family in a packaged form. Best for resorts, rural residential, and any site where land is cheap and the operator skill set is limited; rarely appropriate for high-load industrial wastewater.
MBBR / packed-bed biofilm. The middle ground. Tolerates hydraulic and organic shock loads, no sludge recirculation, and is showing the fastest 2026 growth in food & beverage decentralized deployments where load swings follow seasonal campaigns. Energy use sits between SBR and MBR.
2026 CAPEX and OPEX Benchmarks by Capacity Band
2026 installed-cost benchmarks for packaged and containerized decentralized systems are best read as bands, not point estimates, because civil work, freight, and local labor move the numbers far more than the OEM hardware itself. The table below is calibrated against publicly reported 2024–2025 municipal tenders and OEM-published reference plants, and should be treated as a sanity-check range when normalizing vendor quotes.
| Capacity Band | Typical Installed CAPEX (turnkey, USD) | Indicative OPEX (USD/m³ treated) | Dominant Process Choice |
|---|---|---|---|
| 1–50 m³/day | $15,000–$80,000 | $0.20–$0.60 | Packaged SBR / WSZ underground integrated |
| 50–500 m³/day | $80,000–$450,000 | $0.15–$0.50 | Containerized MBR / MBBR |
| 500–2,000 m³/day | $0.45M–$1.8M | $0.12–$0.40 | Modular MBR + reuse polish |
| 2,000–5,000 m³/day | $1.5M–$5.5M | $0.10–$0.30 | EPC turnkey MBR, often with sludge handling |
OPEX is dominated by aeration energy (typically 0.4–1.0 kWh/m³ for MBR), chemical dosing, membrane replacement on a 5–8 year cycle, and sludge handling. Sludge is the line item most often underestimated on a 10-year TCO; buyers should pre-size dewatering using a plate-frame filter press duty matched to their primary clarifier or MBR waste-activation flow, and run the 7-lever optimization in the sludge disposal cost optimization guide before signing. As a rule of thumb, Asian OEM packaged units run 30–50% below Western EPC turnkey on equivalent scope; mid-tier European EPCs typically fall between the two and carry the strongest documentation package.
Compliance and Reuse: Which Key Players Clear Your 2026 Bar
Compliance is the single hard filter that disqualifies a vendor regardless of price. The 2026 regulatory map is jurisdiction-specific, and OEMs differ in how cleanly they map to each.
In the EU, the UWWTD 91/271/EEC and the Industrial Emissions Directive 2010/75/EU set the minimum bar for any cross-border project, with national annexes (e.g. Germany's AbwV, Italy's D.Lgs. 152/2006) tightening sector limits. In the US, EPA 40 CFR 503 governs biosolids reuse, while state-level Title 22 (California), Wastewater Design Standards (Texas), and onsite system rules (Oregon) govern the effluent envelope. China still references GB 18918-2002 Grade 1A for most reuse tenders, with the 2025 revision of GB/T 31962 tightening influent characterization. Middle East tenders typically bundle federal and emirate-level reuse standards (e.g. UAE Federal Law No. 24 of 1999, Saudi NWC specs) and require dual-language documentation.
For disinfection-side compliance — frequently the line that fails a third-party audit — the HydropureWater chlorine dioxide generator and the medical wastewater treatment system are specified against WHO and EPA drinking-water guideline values for hospitals and pharmaceutical plants. Before shortlisting, request the OEM's most recent third-party effluent test report matched to your target discharge or reuse standard, and confirm that the test was run on a plant in your capacity band, not a lab-scale skid.
Shortlist Decision Framework for Industrial Buyers
A defensible 2026 shortlist drops out of a four-step filter, applied in order.
- Capacity and influent filter. Match peak daily flow and influent BOD/COD/FOG/Salt to the OEM's reference plants. Reject any vendor whose largest comparable install is more than 5× your design flow or in a fundamentally different influent class.
- Discharge and reuse destination. Surface-water discharge, sewer, on-site irrigation, or industrial reuse each set a different effluent envelope. MBR is the only architecture that consistently hits reuse-grade without downstream polish.
- Local service footprint. Verify that the OEM or its authorized integrator can commission, train, and supply spares within 48 hours on-site. Containerized systems reduce this to a logistics problem rather than a field-engineering problem.
- Verified reference plant in your industry. A reference visit, or at minimum a 12-month operating data set, is worth more than any brochure.
Choosing on CAPEX alone is the most common 2026 mistake. Lifecycle OPEX, membrane availability, and the cost of a missed compliance sample typically decide the 10-year total cost of ownership. The right output is a 2–3 vendor shortlist fed a common technical datasheet so proposals are like-for-like on flow, effluent targets, and warranty terms.
Frequently Asked Questions
What capacity range defines a "decentralized" wastewater treatment plant in 2026? The 2026 working definition is sub-5 MLD (≈5,000 m³/day) packaged, containerized, or modular systems, replacing the older "small community" framing tied to septic systems (per EPA decentralized wastewater policy updates, 2024–2025).
Which OEM tier should an industrial buyer at 100–500 m³/day target? Most 2026 RFPs at this size land in Tier 2 (Asian OEM specialists) or Tier 3 (North American packaged innovators), with Tier 1 EPCs typically winning only when the scope exceeds 1 MLD or carries a long-term O&M contract.
How long do MBR membranes last before replacement? PVDF submerged MBR membranes in decentralized service typically run 5–8 years before replacement, depending on cleaning regime, FOG loading, and operating flux (HydropureWater field data, 2026; consistent with Kubota and Enereau published service intervals).
What is the single most common reason decentralized WWTP projects miss their reuse-grade target? Inconsistent influent characterization during design, followed by inadequate FOG/surfactant pre-treatment ahead of the MBR — both surface in third-party effluent audits more often than membrane or process selection errors.
Are regional skid-builders a defensible shortlist member in 2026? For sub-100 m³/day sites with stable, low-load influent, yes — they typically offer the fastest delivery and lowest price. For variable or high-load industrial wastewater, they rarely clear a 10-year TCO comparison against Tier 2 or Tier 3 OEMs.